|
Section 1: Overall Competitiveness 1.
Gross Value Added and Household
Disposable Income per Head
Gross
Value Added (GVA) and Household Sector
Disposable Income (HDI) measure different
aspects of a region’s income.
GVA gives an indication of the value of
the economic activity generated within an
area, while HDI provides an indication of the
income received by resident households and
non-profit organisations that serve
households.
The
regional GVA estimates included in this
publication are those published by the Office
for National Statistics (ONS) on 1st
March 2001.
The revised regional GVA estimates
published on 21st November 2002
were withdrawn owing to concerns over the
quality of the component data used to
calculate the figures. ONS report that revised
regional GVA estimates from 1989 to 2001 will
be published during spring 2003 (see ONS
Release of 10 December 2002).
GVA
per Head
GVA
measures the economic activity generated
within a region through the production of new
goods and services. Table 1(a)i and
1(a)ii
detail GVA at current prices in £s per head
and £s per head indexed to the UK average.
Between
1989 and 1999, London consistently had the
highest GVA per head of population, growing
from £11,634 in 1989 to £18,979 in 1999
(varying between 142 and 148 per cent of the
UK average during these years).
Map 1(b) shows that the greatest rate
of increase over the ten years was in the
South East, where GVA per head at current
prices rose by just under 77 per cent.
GVA per head in Northern Ireland grew
at the second highest rate, up by 71 per cent.
The North East, by contrast, was the
slowest growing, increasing by around 52 per
cent during this time.
Over the same period, the Retail Price
Index (RPI) increased by 44 per cent.
GVA
per Hour Worked
The
estimates in Table 1(b) and Chart 1(b)
overcome one of the issues affecting GVA per
head of population as an indicator. The GVA
generated within a region - Table 1(a) - is
workplace based, while the population estimate
is based on persons residing within a region.
Thus commuting may distort the GVA per
head estimates for regions with a high level
of inward commuting, such as London, and could
artificially inflate the GVA per head
estimate.
In
Table 1(b), GVA is presented relative to the
number of hours worked in the region, rather
than in terms of per head of population
resident.
London, at 116.7 per cent in 1999, is
greater than the average (UK=100) but the
differences between regions are not as marked
as for GVA per head of resident population.
The lowest figure for relative GVA per
hour during 1999 was for Northern Ireland, at
83.5. Of
the English regions, the lowest figures were
recorded in the West Midlands and the South
West at 90.3 and 90.4 respectively.
Gross
Household Disposable Income per Head
Disposable
household income is defined as
total household income (including benefits)
less current taxes on income, wealth and other
social contributions.
While GVA gives an indication of the
value of all economic activity in a given
area, Household Disposable Income (HDI), (Tables 1(c)i and
1(c)ii), measures what
financial resources households have available
to spend on goods and services.
During
1999, disposable household income per head of
population in London at £12,207 was 20
percentage points above UK income per head (£10,142).
Wales had the lowest relative income at £8,870
per head, 13 percentage points below the UK
average. Between 1995 and 1999, the index of
income per head for Wales fell by 4 points,
the largest fall in any UK region or country
during this time.
Chart
1(a)
Map
1(b)
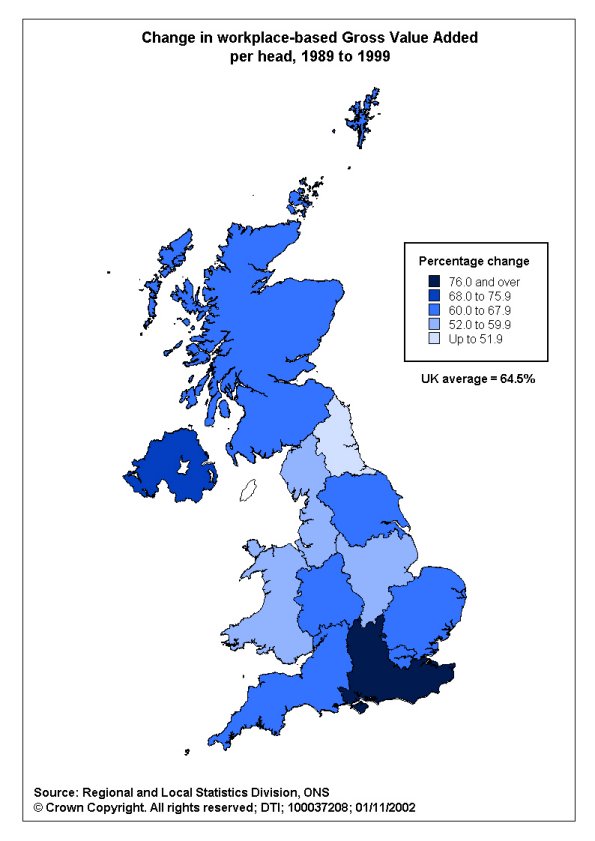
Chart 1(b)
Chart
1(c)
2.
Labour Productivity in Manufacturing
and Other Industries
This
is used as an indicator of competitiveness
within the manufacturing and other sectors
(including services, fuel extraction,
electricity and gas supply, but not
agriculture, forestry and fishing).
Tables 2(a) and
2(b) are calculated as
GVA per employee.
Growth
in GVA per manufacturing employee was highest
in Yorkshire and the Humber at 15 per cent
between 1995 and 1998, followed by the East
Midlands (14.6%), West Midlands (13.9%) and
the East of England (12.9%). Growth in GVA per
manufacturing employee in other regions was
below Retail Price Index (RPI) inflation (11
per cent over this period).
Growth
in the other sectors has been somewhat
stronger, with GVA per employee in both the
East and London growing by just over 17 per
cent between 1995 and 1998.
Yorkshire & the Humber, East
Midlands, South East, South West and Scotland
grew at a faster rate than RPI inflation
during this time.
It
is important to consider the value of these
indicators in the context of the mix of
industries between regions.
Some industries are highly labour
intensive and so may have relatively low
productivity figures when compared with the
more capital-intensive industries.
Chart
2 illustrates the value of GVA per employee
for the manufacturing and other sectors in the
UK regions.
Chart 2
 3.
Investment and Output by UK and Foreign
Owned Companies.
This
series is included as an indicator of the
importance of both domestic and foreign
investment to the industrial base of each
region. Tables 3(a) and
3(b) show the trends
in the figures for the investment (measured by
net capital expenditure of firms) and output
(measured by gross value added) of
foreign-owned companies.
Due to issues concerning the quality of the sub - national ABI/2 estimates (for 1998 to 2001) raised by the Office for National Statistics, the data were not available in time for the January 2003 issue of ‘Regional Competitiveness and State of the Regions’. The historic Annual Census of Production data to 1997 have been included for the time being in Table 3. 4.
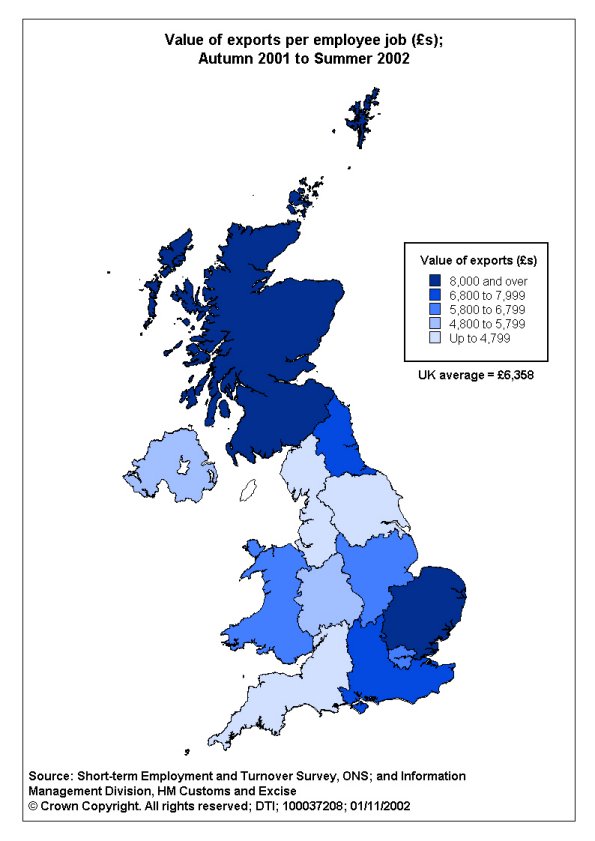
Exports of Goods
The
value of exports produced is dependent on the
size of a region’s economy and it is
important to note that the production of some
goods (for example motor vehicles), can
involve several separate stages of production
that may take place across more than one
region, therefore these figures should
therefore be interpreted carefully. This indicator does not include the value of the export of
services.
Table
4(a) provides the value of exports of
goods from each region in each quarter between
2000 and the second quarter of 2002.
Table
4(b) provides an estimate of the number of
companies in each region exporting to the
European Union (EU) and outside the EU from
2000 to the second quarter of 2002.
The counts of companies exporting to
the EU and rest of the world in Table 4(b) are
not wholly comparable. See Definitions for
further details.
Map 4(b) and Chart 4(b) illustrate the value of exports for quarters covering 2000 – 2001 and 2001 - 2002 per employee job within each region. Between Autumn 2001 and summer 2002, the value of exports per employee job was highest in Scotland at just over £8,900 (some 41 per cent above the value of exports per job across the UK as a whole). The East was next highest with exports per job at just over £8,650. Yorkshire and the Humber had the lowest value at just over £4,300 per employee job, less than half of the value per job in Scotland. Table 4(c) shows the distribution of regional exports to the main world regions. During 2001, the EU was the largest recipient of exported goods in all of the UK regions with nearly 60 per cent of UK exports as a whole received by EU countries, over 3 times more goods than were exported to the UK’s next largest recipient, North America.
Chart 4b
Map
4(b)
Home - Search - Site Map - Contact Us |