Section 2: The Labour Market5.
Average Earnings
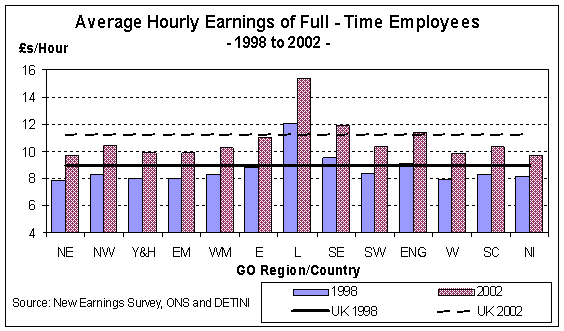
Tables 5(a), 5(b) and 5(c) display the gross average hourly earnings for full-time employees in total and for manufacturing and service industries separately by sex. Chart 5 illustrates the changes in average hourly earnings of full - time employees between 1998 and 2002. During
2002, the hourly earnings (including overtime)
of full-time employees in London were higher
than any other UK region at £15.40 (an
increase of just over 5 per cent on the
previous year). Earnings in the South
East were next highest at £11.90 per hour.
This compares to an average of £11.20 per
hour for the UK as a whole. During 2002, the
lowest earnings were recorded in Northern
Ireland and the North East at £9.70 per hour.
However, growth in hourly earnings in the
North East between 2001 and 2002, at nearly 7
per cent, was among the highest in any region
of the UK (as compared to a UK average of just
below 6 per cent).
Growth
in earnings between 1998 and 2002 for the UK
as a whole was just over 25 per cent, with
London, again growing most quickly with an
increase of 28 per cent. Earnings in Northern
Ireland grew at the slowest rate during this
period, with a rise of just over 18 per cent.
This was nearly 7 percentage points
below the increase across the UK as a whole
between 1998 and 2002.
However, comparisons of the value of hourly earnings between regions as well as over time should be interpreted with caution. These estimates do not take account of regional variations in the cost of living and to that extent, do not represent the true ‘buying power’ of these earnings. No Retail Price Indices are produced for individual regions by ONS. Chart 5
6.
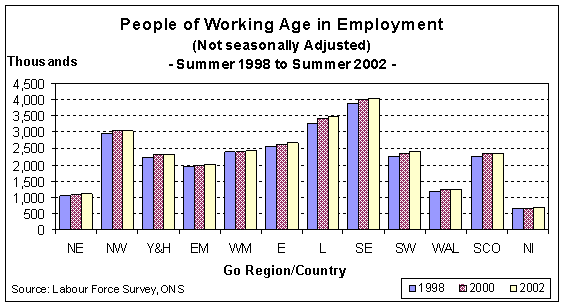
Employment
Chart and Table 6(a) detail the number of people of working age who are in employment (by their region of residence) whilst Chart and Table 6(b) illustrate this as a proportion of working age people. The Labour Force Survey employment estimates used in Tables 6(a) and 6(b) are only consistent with the 2001 Census population at the UK level. For further details refer to the first paragraph of the Definitions Section. During
the summer of 2002, three quarters of working
age people in the UK were in employment.
The non - seasonally adjusted number of
people in employment was the highest ever
measured by the Labour Force Survey.
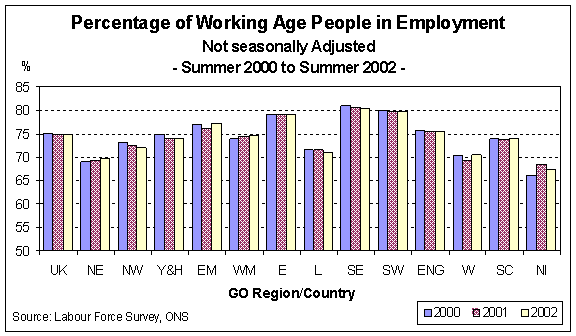
The highest proportion of the resident
working age population in employment was in
the South East at just over 80 per cent. In
each quarter in Table
6(b), the South East had
the highest proportion of working age people
in employment.
The lowest proportion during summer
2002 occurred in Northern Ireland at just
below 68 per cent. This was 7 percentage
points below the rate for the UK.
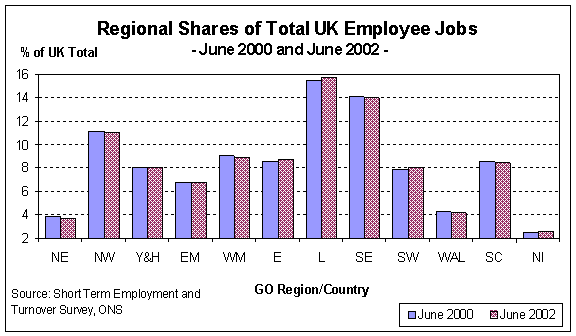
Table 6(c) and Chart 6(c) cover each region’s share and total number of employee jobs in the UK between June 2000 and June 2002. London is the biggest single labour market containing around 16 per cent of all employee jobs within the UK during this time. The level of employee jobs grew most quickly in the South West, with jobs levels increasing by more than 3 per cent between 2000 and 2002. This was nearly 5 times the growth rate evident across the UK as a whole during the same time. The largest decrease over the same period occurred in the North East, with a fall in jobs levels of just over 2.5 per cent. Relatively
high levels of commuting into London should be
taken into consideration when looking at
region’s shares of the UK labour market. The
Labour Force Survey assigns employees to where
they live in those cases where their region of
work and residence are different, and
indicates that approximately 12.5 per cent of
workers in the UK actually lived in London
during summer 2002.
Chart 6(a)
Chart
6(b)
Chart
6(c)
7
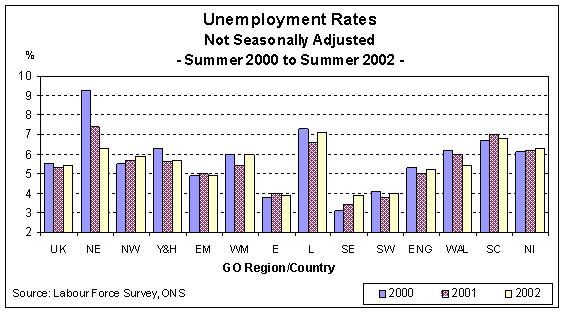
Unemployment
UK
unemployment is measured by the Labour Force
Survey (LFS). Chart 7(a) details the non -
seasonally adjusted unemployment rate between
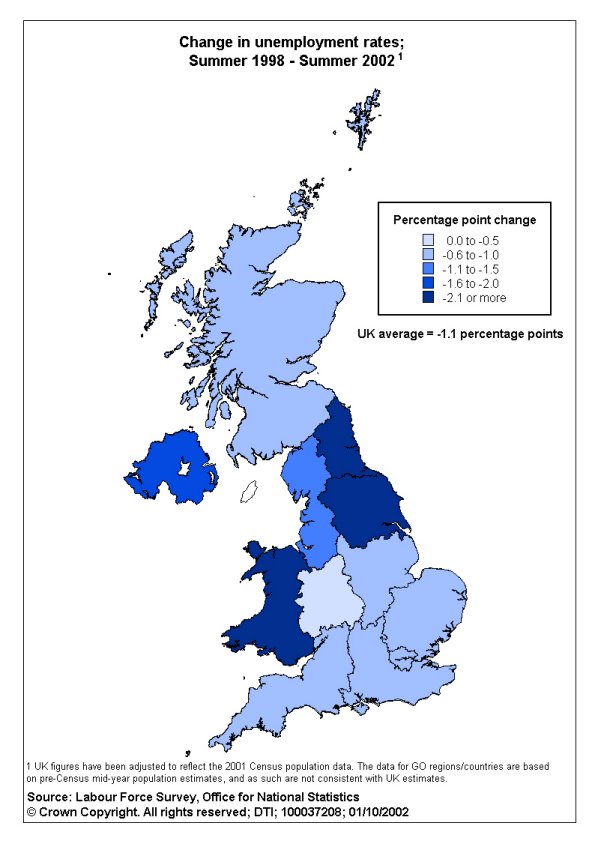
2000 and 2002, with Map 7(b) illustrating the
fall in the unemployment rate between summer
1998 and summer 2002.
During
summer 2002, the unemployment rate was lowest
in the South East and East regions at 3.9 per
cent, as compared to a rate for the UK as a
whole of 5.4 per cent. During this time,
London had the highest rate of unemployment of
any UK region (at 7.1 per cent), a rise of
half a percentage point on the same period a
year earlier.
Map 7(b), illustrates that falls in the unemployment rates occurred in every UK region between summer 1998 and summer 2002. The largest falls were in the North East and Yorkshire and Humberside, with the rate for both regions falling by 2.3 percentage points over this period, and in Wales where unemployment fell by 2.2 percentage points – compared with an overall decrease across the UK as a whole of 1.1 percentage points.
Chart 7(a)
Map
7(b)
 8.
Claimant Count
The Claimant Count is the number of people claiming unemployment related benefits such as Job Seeker’s Allowance, taken from monthly records. Table 8(a) gives the claimant count rate as a proportion of workforce jobs (plus claimants) in the region. Claimant
Count rates during October 2002 were highest
in the North East with a rate of 4.9 per cent,
and lowest in the South East at 1.7 per cent.
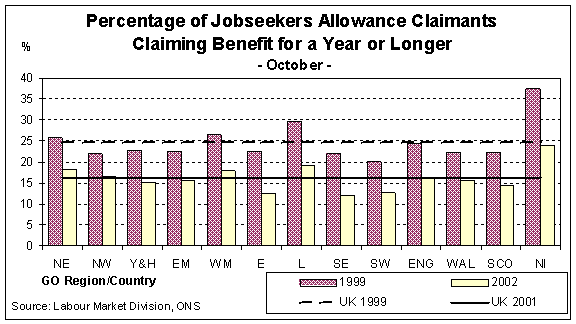
Table
8(b) details the proportion of all claimants
in receipt of the Job Seeker’s Allowance
benefit for a year or longer. Over the UK as a
whole, this proportion has fallen from just
over 31 per cent of all claimants during
October 1997 to just above 16 per cent in
October 2002 (a fall of nearly 15 percentage
points). The highest percentage of long - term
claimants during October 2002 was in Northern
Ireland, where just below 24 per cent of
benefit recipients had been claiming for a
year or longer. However, between October 1997
and October 2002 the proportion of long-term
claimants in Northern Ireland fell at a much
quicker rate than any other area of the UK
(with a drop of just over 23 percentage points
during this time).
Chart 8(b)
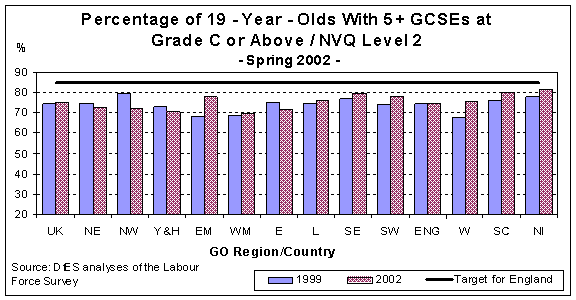
 9. Educational and Vocational Attainment The indicators included within this section relate directly to three of the National Learning Targets for England although data are also provided for Wales, Scotland and Northern Ireland. Refer to Definitions for a full description of the five targets. Table 9(a) and Chart 9(a) detail the proportion of 19 year olds attaining 5 or more GCSEs at grade C or above, or an NVQ level 2 or equivalent. The target for England was for 85 per cent to have achieved this by 2002. During spring 2002 the attainment level for England was nearly 75 per cent, with no individual region achieving the target of 85 per cent. Of the English regions, the South East came closest with just under 80 per cent (an improvement of nearly 2 percentage points on the previous year). Across the UK as a whole, Northern Ireland had the highest attainment rate, at 82 per cent. However, the figures in Table 9(a) are based on a relatively small sample of people and because of this to this can be subject to relatively high levels of sampling variation. Chart 9(a)
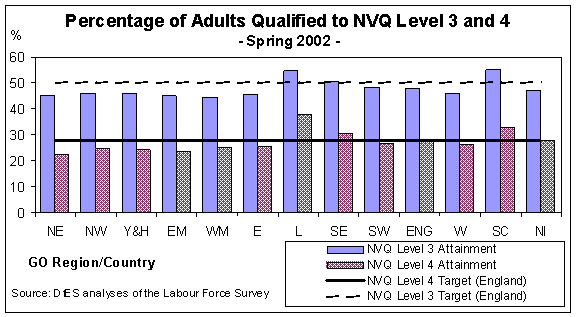
Tables 9(b) and 9(c) and Chart 9(b) provide the proportions of economically active adults qualified to at least NVQ level 3/equivalent (where the England target was 50 per cent of adults by 2002) or NVQ level 4/equivalent (with a target for England of 28 per cent). Across England during spring 2002, 54.5 per cent of economically active adults in London were qualified to NVQ level 3 or above. The South East (at just under 51 per cent) was the only other region apart from London to meet the NVQ level 3 target for England. The
proportion of economically active adults in
both London and the South East with
qualifications at NVQ level 4 or higher has
exceeded the national target consistently over
the period shown in Table 9(c). During
spring 2002 the rates were 38 per cent and
nearly 31 per cent in these regions
respectively.
Across the UK as a whole Scotland had
the second highest NVQ level 4 rate of
achievement at 33 per cent.
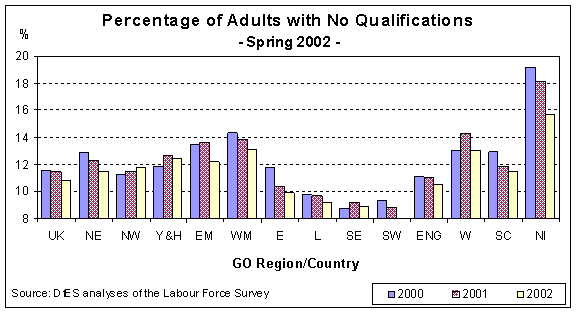
Chart
9(d) and Table 9(d) provide the proportion of
economically active persons in each region who
have no qualifications. As at spring 2002,
Northern Ireland (at nearly 16 per cent) and
Wales (at just over 13 per cent), had the
highest percentages of economically active
adults with no qualifications in UK.
However, the proportion in Northern
Ireland had decreased by over two percentage
points from the previous year. The lowest
figure was in the South West and West Midlands
(with both at just under 8 per cent).
These estimates should be interpreted with care. The results for London and the South East in particular, say as much about the economic ‘pull’ of these regions and the mobility of people with certain qualifications, as they do about the social and demographic characteristics of other regions. Chart 9(b)
Chart 9(d)
Home - Search - Site Map - Contact Us |