Section 1 Overall Competitiveness
1. Gross Value Added (workplace basis) and gross disposable household income per head
Gross Value Added (GVA) and Gross Disposable Household Income (GDHI) measure different aspects of a region�s income. GVA gives an indication of the value of the economic activity generated within an area, while GDHI provides an indication of the income received by resident households and non-profit organisations that serve households.
Workplace-based GVA allocates the incomes of commuters to where they work, rather than where they live. Workplace and residence estimates differ only in the East of England, London and the South East.
The regional GVA estimates included in this publication are those published by the Office for National Statistics (ONS) on 15 December 2006.
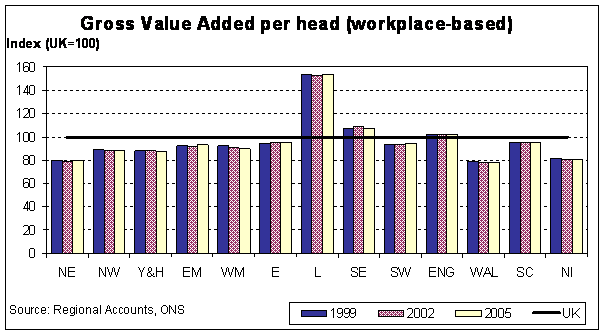
GVA (workplace basis) per head
GVA measures the economic activity generated within a region through the production of new goods and services. Table 1(a)(i) and 1(a)(ii) detail GVA at current prices in � per head indexed to the UK average, and � per head.
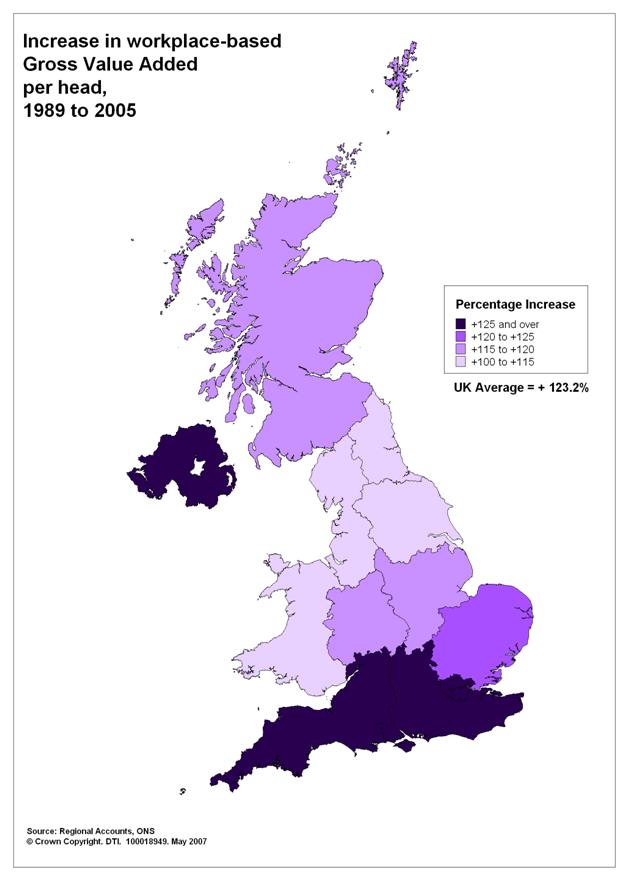
Between 1989 and 2005, London consistently had the highest GVA per head of population, growing from �11,877 in 1989 to �27,088 in 2005 (usually about 150 per cent of the UK average during these years). The South East and Northern Ireland had the greatest percentage increase during this time, at about 140 per cent. By contrast, Wales and the North East were the slowest growing, increasing by 106 per cent and 111 per cent respectively between 1989 and 2005. Over the same period, the all items Retail Price Index (RPI) increased by 72 per cent.
Chart 1(a)
 �
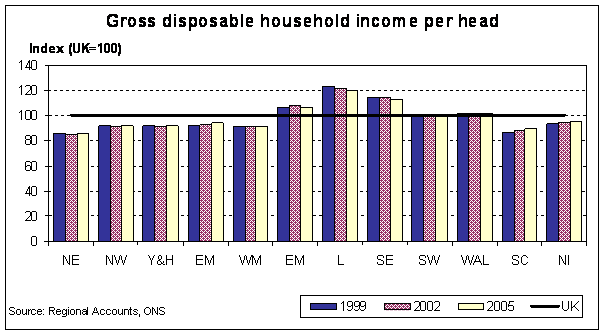
�Gross disposable household income per head
Disposable household income is defined as total household income (including
benefits) less current taxes on income, wealth and other social contributions.
While GVA gives an indication of the value of all economic activity in a given
area, gross disposable household income (GDHI), (Tables 1(b)(i) and 1(b)(ii)),
measures what financial resources households have available to spend on goods
and services.
During 2005, GDHI per head of population in London, at �15,885, was 20 per cent
above UK income per head (�13,279). The only other regions with above average
GDHI in 2005 were the South East (�14,941) and the East of England (�14,198).
The North East and Northern Ireland had the lowest relative income at �11,356
and �11,564 per head respectively, 15 and 13 percentage points below the UK
average.
All the UK regions have experienced growth in GDHI. Between 1995 and 2005, the
index of income per head for the North East fell by almost 2.3 points, the
largest fall in any UK region or country during this time, whereas the index for
the South East rose 1.6 points. The South East also had the highest growth at
just over 57 per cent in the same period.
Chart 1(b)
 �
�
Map 1(a)
 �
�
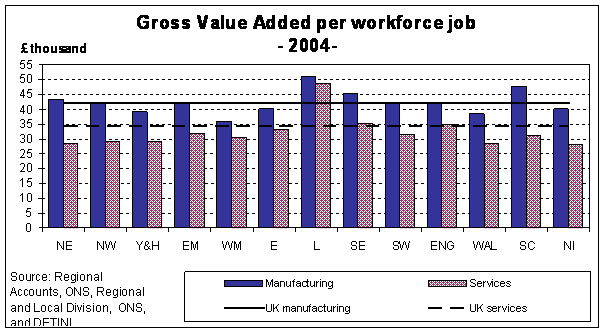
2. Labour productivity
This is an indicator of competitiveness within the manufacturing, services and other sectors (including agriculture, forestry and fishing, fuel extraction, electricity and gas supply and construction). Table 2(a) is calculated as GVA per workforce job.
Growth in GVA per workforce job in manufacturing between 1996 and 2004 was highest in Northern Ireland at 47 per cent, followed by the South West, at 42 per cent. Over the same period in the manufacturing sector, Wales had the lowest growth rate (only 13%).
In the services sector, the fastest growing regions were the East Midlands and London which had growth of about 55 per cent between 1996 and 2004. Northern Ireland experienced the slowest growth at just over 38 per cent, followed by the North East and Wales with 42 and 43 per cent growth over the period. The remaining (�other�) sectors show more variation between regions: West Midlands increased by almost 47 per cent between 1996 and 2003, while Northern Ireland experienced growth of just 17 per cent.
It is important to consider the value of these indicators in the context of the mix of industries between regions. Some industries are highly labour intensive and so may have relatively low productivity figures when compared with the more capital-intensive industries. Chart 2(a) illustrates the value of GVA per workforce job for manufacturing and services in the UK regions.
Chart 2(a)
GVA per job filled and per hour worked
The estimates in Tables 2(b)(i) and 2(b)(ii) along with Charts 2(b)(i) and 2(b)(ii) overcome two of the issues affecting GVA per head of population as an indicator. The GVA generated within a region - Table 1(a) - is workplace-based, while the population estimate is based on persons residing within a region. Thus commuting may artificially inflate the GVA per head estimates for regions with a high level of inward commuting, such as London.
GVA in table 2(b)(i) is shown relative to the number of jobs filled in the region and is used as a proxy for GVA per worker. This measure allows fairer comparison of productivity across regions, taking into account total numbers of filled jobs within an area. In 2005 London had the highest GVA per job filled at 129 per cent of the UK average. The difference between the other regions was less marked than for GVA per head of population (table 1(a)) with all indices being within roughly 10 per cent of the average, except for Northern Ireland,15 per cent lower than the UK average.
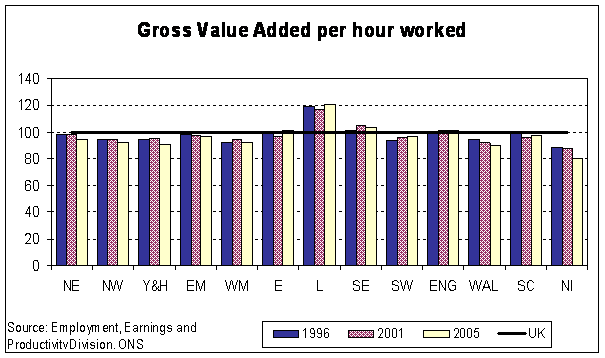
In Table 2(b)(ii), GVA is presented relative to the number of hours worked in the region. Similar patterns to table 2(b)(i) emerge with London being the highest, at 121 per cent of the UK average in 2005, and the differences between regions are not as marked as for GVA per head of population. The lowest figure for relative GVA per hour during 2005 was for Northern Ireland, at 80 per cent of the UK average. Of the English regions, the lowest figures were recorded in the Yorkshire and Humber at 90.6 per cent, followed by the North West as the next lowest at 91.8 per cent.
An article by New and Virdee examining the differences between the different perceptions of relative regional performance that are obtained by using different measures of productivity or related concepts can be found in Regional Trends No 39, or online at http://www.statistics.gov.uk/cci/article.asp?id=1558.
Chart 2(b)(i)
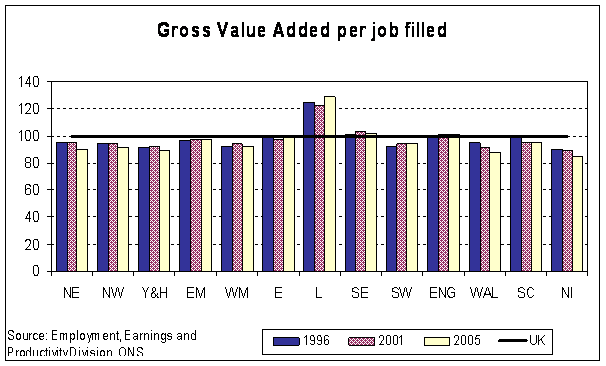
Chart 2(b)(ii)
3. Investment and output by UK and foreign-owned companies by broad industry
sector
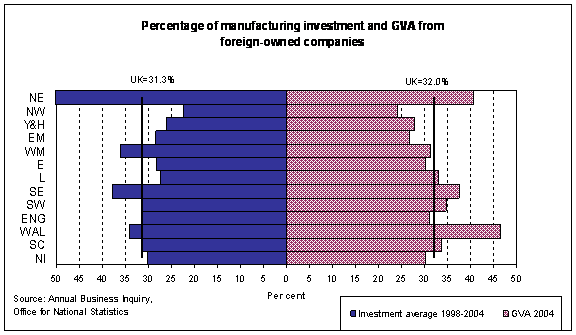
This series is included as an indicator of the importance of both domestic and foreign investment to the industrial base of each region. Tables 3(a) and 3(b) show the trends in the figures for the investment and output of foreign-owned and UK-owned companies between 1998 and 2004.
Net Capital Expenditure of firms is used as a proxy for investment. The estimates should be treated with caution as large, one-off investment decisions by companies can make significant differences to total investment figures in a particular region or year and allocation of capital expenditure across regions is particularly difficult. To go some way towards overcoming this, manufacturing investment from foreign-owned companies in Chart 3 is shown as an average for the years 1998 to 2004.
Over this period, an average of �15.5 billion per year was invested in manufacturing in the UK, and just over 31 per cent of this was from foreign-owned companies. During the same time, an average of �55.4 billion per year was invested in services in the UK of which 12 per cent was from foreign-owned companies.
GVA is used as a proxy for output. These GVA data are taken from the Annual Business Inquiry and do not correspond to those in the Regional GVA Release published by Regional Accounts, ONS. See Definitions for further details.
In 2004 32 per cent of UK output (as measured by GVA) in the manufacturing sector was from foreign-owned companies. Output from foreign-owned companies, as a proportion of total manufacturing output, was highest in Wales and the North East at 47 and 41 per cent respectively.
Chart 3
4. Exports of goods
The value of exports produced is dependent on the size of a region�s economy. It is important to note that the production of some goods (for example motor vehicles) can involve several separate stages of production that may take place across more than one region, so these figures should be interpreted carefully.
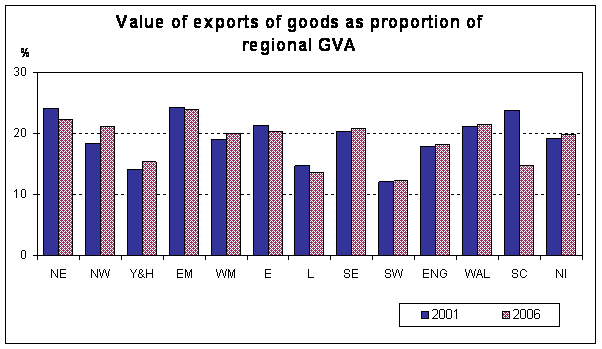
Table 4(a)(i) provides the value of exports of goods from each region in each quarter between 2001 and 2006 and table 4(a)(ii) presents these as a proportion of headline regional GVA. Table 4(b)(i) provides an estimate of the total number of companies in each region exporting outside the UK from 2001 to 2006. Table 4(b)(ii) shows the number of companies in each region exporting goods to the European Union (EU25) and outside the EU25. As traders may export to both EU and non-EU countries, the sum of the two does not correspond to the totals in table 4(b)(i). As well as this, the counts of companies exporting to the EU and the Rest of the World in Table 4(b)(ii) are not wholly comparable. See Definitions for further details.
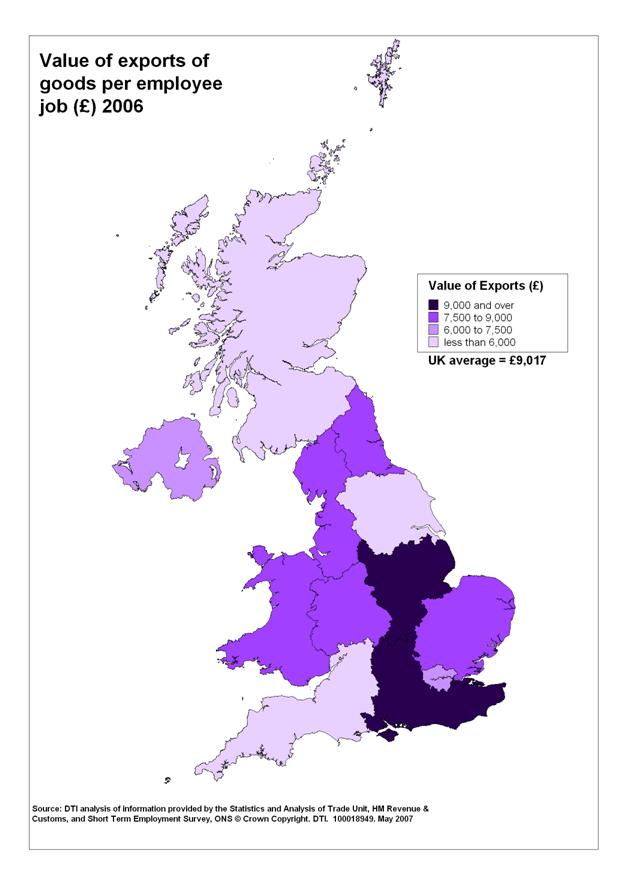
Chart 4(a) illustrates the value of exports per employee job (jn all industries; thus industrial composition may affect comparisons) from 2001 to 2006 within each region. Map 4(b) shows the same information for 2006 only. In 2006, the value of exports per employee job was highest in the East Midlands at just under �9,900. The South West yielded the lowest value at around �5,000 per employee. Between 2001 and 2006 the value of exports per employee job in the UK increased by 22 per cent. Within the regions, there was a decrease of 25 per cent in Scotland in the same period. This difference between regions is also reflected in the total value of exported goods where Scotland fell 20 per cent but here Yorkshire and the Humber rose 41 per cent between 2001 and 2006. The reader should note that first two quarters of 2006 data contained in table 4(a)(i), have been particularly affected by transactions associated with Missing Trader VAT Fraud with the EU. See Definitions for further details.
Chart 4(a)(i)
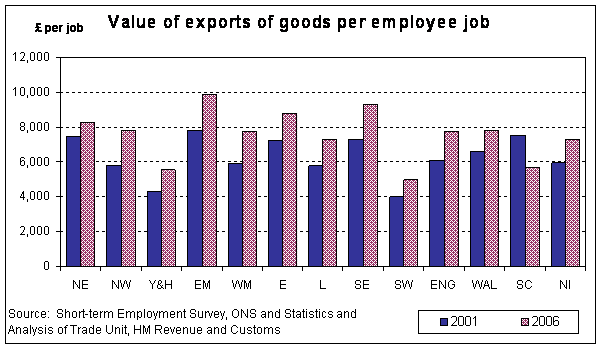
Chart 4(a)(ii)
Between the fourth quarters of 2001 and 2006, the number of companies exporting
goods increased in the UK by 13 per cent (from 45,500 to 51,300 exporting
companies). However Table 4(b)(i) shows that there was a fall across most
regions between the fourth quarters of 2005 and 2006. The number of companies
exporting outside the EU increased significantly in Northern Ireland (15%)
between the fourth quarters of 2005 and 2006, with other regions remaining
relatively stable.
Chart 4(b)
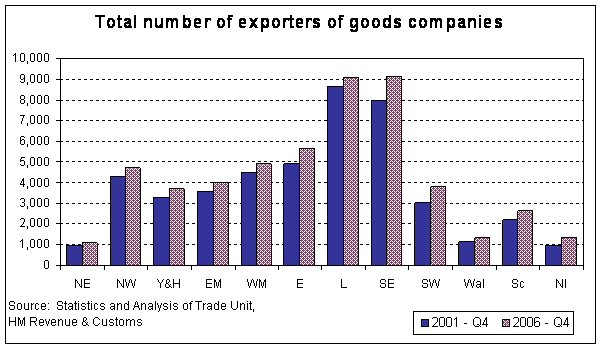
Table 4(c) shows the distribution of regional exports to the main world regions.
During 2006, the EU was the largest recipient of exported goods in all of the UK
regions, taking an overall 61.8 per cent (by value) of UK. This was more than
four times the value of the goods exported to the UK�s next largest recipient,
North America.
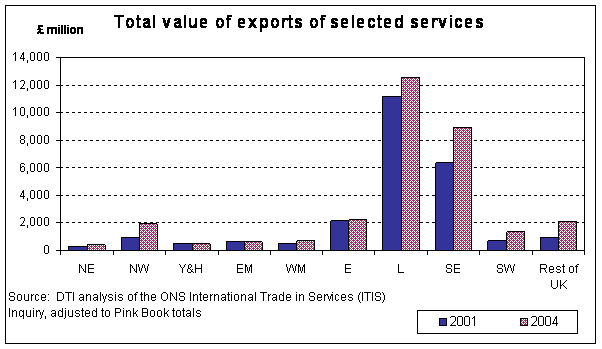
Regional trade in services, taken from the International Trade in Services
(ITIS) Inquiry, are shown in Table and Chart 4(d). London and the South East
dominate in the value of service exports, respectively representing 40 and 28
per cent of total UK exports in 2004. Figures should be used with caution as the ITIS only covers roughly a third of all UK service exports.
Chart 4(d)
Map 4(b)
�