Section 2: The Labour Market6.
Average Earnings
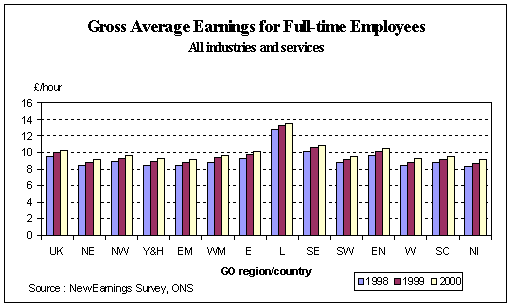
High earnings can be indicative of a region’s competitiveness if they are supported by high productivity, if not they can have an adverse effect on long - term competitiveness. During 2000, hourly earnings were highest in London at £13.60 for full time employees, with earnings in the South East next highest at £10.90 per hour, compared to an average of £10.30 for the UK as a whole. The lowest hourly earnings were recorded in the North East, the East Midlands, Wales and Northern Ireland (all £9.20 per hour). However, comparisons of the value of hourly earnings both between regions and over time should be interpreted with caution. These estimates do not take account of regional variations in the cost of living over these years and because of this, do not represent the true ‘buying power’ of these earnings. No Retail Price Indices are produced for individual regions. Tables 6(a), 6(b) and 6(c) show gross average hourly earnings for full-time employees by manufacturing and service industries by sex..
Chart 6
7.
Employment
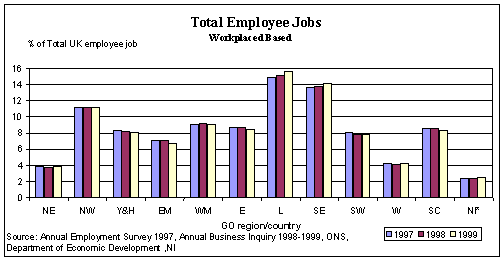
During Spring (March-May) 2001 nearly three quarters of working age people in the UK were in employment. The number of persons in employment was at the highest level ever measured by the Labour Force Survey. By region, the greatest proportion of the working age population employed was in the South East at more than 80%. The lowest proportion in employment was in Northern Ireland (67.8%). Chart 7(a) details the number of people of working age in employment by region of residence and Chart 7(b) illustrates this as a proportion of working age people. Chart 7(c) shows the proportions of total UK employee jobs for each region. The chart illustrates how London contributes a greater proportion of employee jobs to the overall total (15.7% in March 2001) than is accounted for by the proportion of the workforce who are resident in London (12.3%).
Chart 7(a)
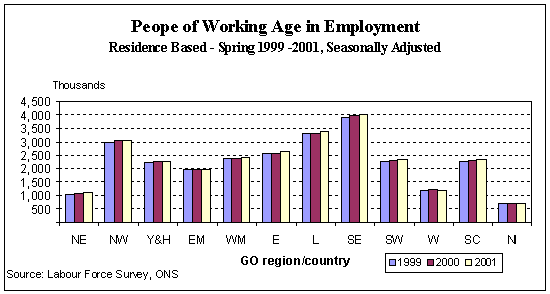
Chart 7(b)
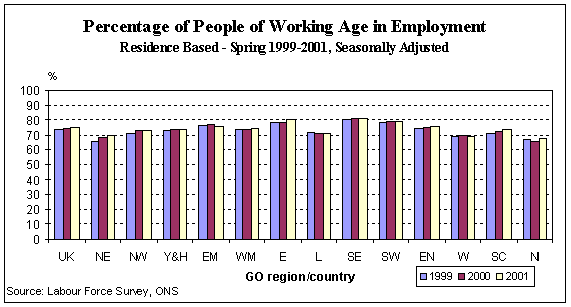
Chart 7(c)
8.
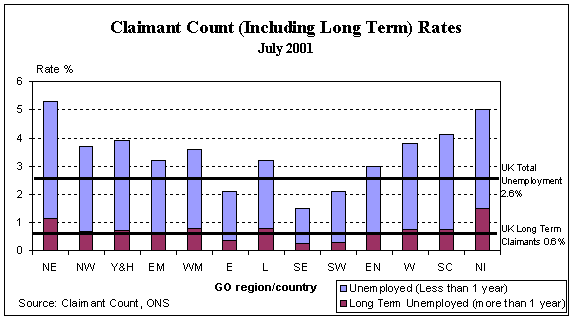
Unemployment
This is a key measure of labour market performance. The unemployment rate is sometimes used as a measure of the ‘tightness’ of the regional labour market, although within a region there can be significant differences at local labour market level. The proportion of long-term unemployed is a measure of long term exclusion from participation in the labour market. There are two main measures of unemployment used in the UK. The first is derived from the Labour Force Survey (LFS) which uses the International Labour Organisation (ILO) definition of unemployment. The second measure is the claimant count which is taken from the monthly records of people claiming unemployment-related benefits. The claimant count and LFS unemployment rates are included in Charts 8(a) and 8(b). The LFS and claimant count unemployment rates are complementary: the former gives the proportion of ILO unemployed out of the total number of economically active residents; the latter is an indicator of unemployment in an area relative to the size of its workforce (workforce jobs plus claimants). Although there is a large degree of overlap between these definitions and rates of unemployment, the ILO and Claimant Count levels and rates do differ in some regions. Claimants may appear in one set of unemployment figures and not the other if, for example, a person is not eligible for Job Seeker's Allowance and has not registered as unemployed. On the other hand some of the registered unemployed would not be included in the ILO measure if they had done some paid work in the reference week. Differences between the two measures of unemployment can occur where a region has significantly more commuting in to or out of the region for work. For example, in London where there is a high level of in-commuting, the claimant count is lower, partly because the workforce is significantly larger than the economically active resident population. During the spring quarter of 2001, the North East (7.4%) had the highest ILO unemployment rate of the regions and countries, while the lowest rate (3.1%) was in the South East. The pattern for the claimant count unemployment was similar in July 2001, with the North East again having the highest rate (5.3%) and the South East the lowest (1.5%). Although unemployment on both measures has been falling steadily over the time series shown in the Tables (since 1996) the relative position of the regions and Countries has remained fairly stable. Table 8(b)(ii) shows the proportion of all claimant count unemployed in receipt of benefits for a year or more. For the UK as a whole, this proportion has fallen from over 35% during January 1996 to 20% in July 2001. For regions and countries, the highest proportions of long term claimants in July 2001 were in Northern Ireland (just over 30% of the claimant unemployed) followed by London (at just under 24%).
Chart 8(a)
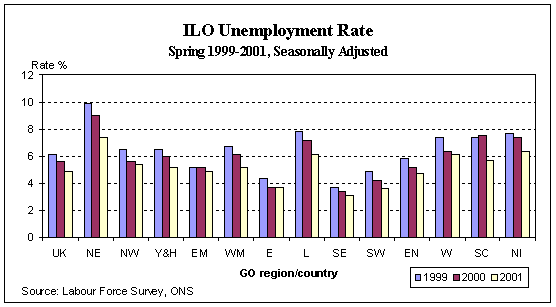
Chart 8(b)
Home - Search - Site Map - Contact Us |