This measure reflects an aspect of entrepreneurial activity in the formation rate of new firms and their ability to survive their first three years of trading.
VAT registrations as a percentage of business stock
An indicator of business formations is the number of new Value Added Tax (VAT) registrations each year as a percentage of enterprises registered for VAT at the end of that year.
The figures in Table 12(a) detail VAT registrations for manufacturing, services and the rest of the economy, while Chart 12(a) illustrates total VAT registrations as a proportion of business stock. Registration rates in manufacturing industries were lower in all regions except in Northern Ireland 2005 compared to 1998. There was a similar pattern in the service industries, with rates falling in all regions, though Northern Ireland remained relatively stable at 9.2 per cent of VAT registered business stock).
The impact of these changes on the UK rate for all industries is a drop from 10.9 per cent of business stock in 1998 to 9.7 per cent in 2001, then increasing to 10.7 per cent in 2003 followed by a decrease to 9.7 per cent in 2005. Between 2004 and 2005, the rate for all industries fell in nearly all English regions, Scotland and Wales.
London had the highest business formation rates in all the years shown for manufacturing, services, and other industries. The relative positions of the other regions and countries did not change markedly between 1998 and 2005, but it is evident that the gap between London and the rest of the UK has narrowed in recent years as registration rates in London have declined more quickly than in other regions.
Chart 12(a)
VAT registrations as a percentage of the adult population
Table 12(b)(i) details business VAT registration per 10,000 adults resident in each region while Table 12(b)(ii) presents registrations per head of adult population in the form of an index where UK=100. Chart 12(b) compares the indices for 1999 through to 2005.
Between 1998 and 2005, registrations per head were lowest in the North East (between 20 and 24 registrations per 10,000 adults each year, not much more than half the UK rate). London had the highest registration rate but the differential compared to the UK as a whole fell considerably over the period. Northern Ireland, Yorkshire and the Humber and the North East showed the biggest relative increases.
The very high registrations/population rate for London is likely to be, at least in part, a result of the high concentration of business in Central London and in-commuting of workers from other regions.
Chart 12(b)
Business survival
Business survival rates detail the proportion of businesses remaining registered for VAT three years after their initial registration, that is, the year shown in Table 12(c) plus 3. Survival rates for the UK have been rising since 1993. Three-year survival rates were just over 62 per cent for firms first registered during 1993, and have increased year on year (with the exception of 1998 when rates fell) to a high of 71.3 per cent for businesses registered during 2002. Chart 12(c) indicates that this overall pattern has been repeated in most of the English regions, as well as in Wales and Scotland. In Northern Ireland three year business survival rates in 2002 were similar to those in 1995.
Chart 12(c)
In addition to business start-up and business survival rates, a general measure of Total Entrepreneurial Activity (TEA) is an indicator of the enterprise within a region. Individuals adding value to the work they do by acting entrepreneurially can contribute to overall competitiveness and productivity. See Definitions section.
TEA (as a proportion of the total adult population) in the UK increased from 5.4 per cent in 2002 to 6.4 per cent in 2003 before dropping to 5.8 per cent in 2006. The rate of TEA increased in all regions between 2002 and 2006, except Scotland which fell marginally. The South West had both the biggest increase (2.6 percentage points over the four years to 2006) and the highest levels of entrepreneurial activity in 2006 at 7.7 per cent.
Chart 13
Table 13(b) details the proportion of adults who expect to start a business in the next three years. This can be used cautiously to gauge entrepreneurial intention across the UK. Between 2003 and 2006, the UK rate increased from 7 per cent to 7.8 per cent. This increase is reflected across most of the English regions except East of England, London and South West and also Wales, Scotland and Northern Ireland, where the rate decreased.
Expenditure on Research & Development (R&D) measures the extent to which sectors are innovating by developing and exploiting new technology, software and ideas. R&D activity can be a stimulant to the competitiveness of firms within a region.
Research and Development and employment in high and medium-high technology industries
Chart 14(a) represents the value of business R&D as a proportion of regional GVA for 1995 to 2004. The R&D data used in this chart and in Table 14(a) are taken from the Survey of Business Enterprise Research and Development and the regional economic accounts, both produced by the ONS (see Definitions).
It is evident that R&D as a proportion of GVA is significantly higher in the East of England than any other region, at 3 per cent in 2004, with proportions relatively low in the North East, Yorkshire and the Humber and London as well as in Wales, Scotland and Northern Ireland. Across regions, expenditure on R&D is higher, as a proportion of output, in the manufacturing sector than in the services sector. R&D expenditure in manufacturing in the East of England was 15.8 per cent of GVA in 2004, while the next highest spend was in the South East, at 13.1 per cent of GVA. Northern Ireland, North East and Yorkshire and the Humber had the lowest proportional spend on R&D in manufacturing, at 2.0 or 2.1 per cent of GVA.
Over the period 1995 to 2004, Wales has seen the proportion of GVA spent on manufacturing R&D more than double, from 1.1 to 2.7 per cent, while the North West of England shows an increase from 4.8 to 8.6 per cent of GVA.
Chart 14(a)
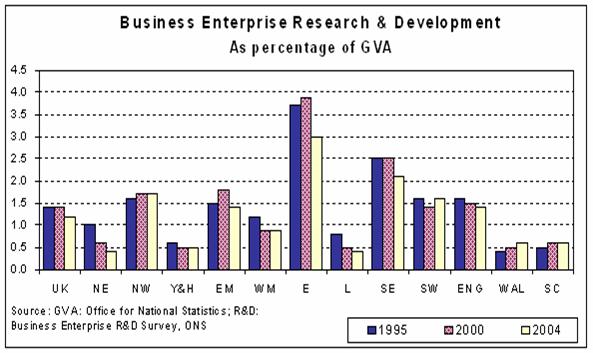
Chart and Table 14(b) show the proportion of employee jobs in high and medium-high technology manufacturing industries. Across the UK, 4 per cent of all employee jobs were classified as high or medium-high technology industries during 2006, a fall of 2.1 percentage points from the 1998 figure. This fall is due to two factors: a decrease of over 25 per cent in the number of UK high and medium-high technology jobs as well as some growth in other sectors of the economy over the 1998 to 2005 period.
The fall in the level of high and medium-high technology jobs between 1998 and 2005 occurred in every region and country. Even though the West Midlands saw a reduction of over 37 per cent between 1998 and 2005, it still had the highest proportion of this type of job (at 5.9 per cent of all employee jobs), with the lowest in London (at 1 per cent). London and Scotland have also been particularly affected, with decreases in the level of these jobs of 44 and 35 per cent respectively.
Chart 14(b)
Gross Domestic Expenditure on Research and Development (GERD) as a percentage of total GVA is a measure commonly used for international comparisons. Table 14(c) draws together information on research and development spending in public and private sectors, incorporating Government and Higher Education sectors as well as business enterprises.
Between 1998 and 2004 in the UK, GERD in each sector has remained fairly constant as a percentage of GVA at around 1.3 per cent for business, 0.2 per cent for Government and 0.4 per cent for Higher Education. In the same period, the East of England has seen the largest decrease in business GERD (0.6 percentage points), whilst for government GERD the South East had the largest fall (0.3 percentage points). Higher education GERD has remained fairly flat across all regions; Northern Ireland having the largest increase of 0.2 per cent points.
Chart 14(c)
Co-operation and new or improved products
Innovation co-operation is the extent to which firms actively participate in joint innovation projects (including research and development) with other organisations. Chart 14(d) shows the percentage of firms within each region reporting co-operation agreements on innovation activities. These figures are based on a sample survey of businesses and are subject to sampling error and the estimates are therefore shown with 95% confidence intervals. See Definitions section for more details on the Community Innovation Survey (CIS).
As can be seen from the chart, confidence intervals for most regions overlap making it difficult to form firm conclusions. However, using the point estimates with caution, most of the regions have similar proportions of firms reporting co-operation agreements (roughly 13-14 per cent) with the exception of Northern Ireland, which has 8 per cent of firms with agreements. The overall UK figure, of around 13 per cent of firms, represents a fairly robust estimate with small confidence intervals.
Chart 14(d)
A further indicator of the level of innovation within industry is the proportion
of turnover that can be attributable to new, improved and novel products. This
can be used to signify the value added by a firm’s innovation practices (e.g.
through research and development). Table 14(e) shows that across the UK, 35 per
cent of turnover in the manufacturing of electrical and optical equipment can be
attributable to new, improved or novel products. This ranges from 51 per cent of
turnover in Northern Ireland and the South East to 16 per cent of turnover in
Scotland.