|
|
Economics and Statistics Website : Regional Economic Performance PSA Indicators |

|
 |
|
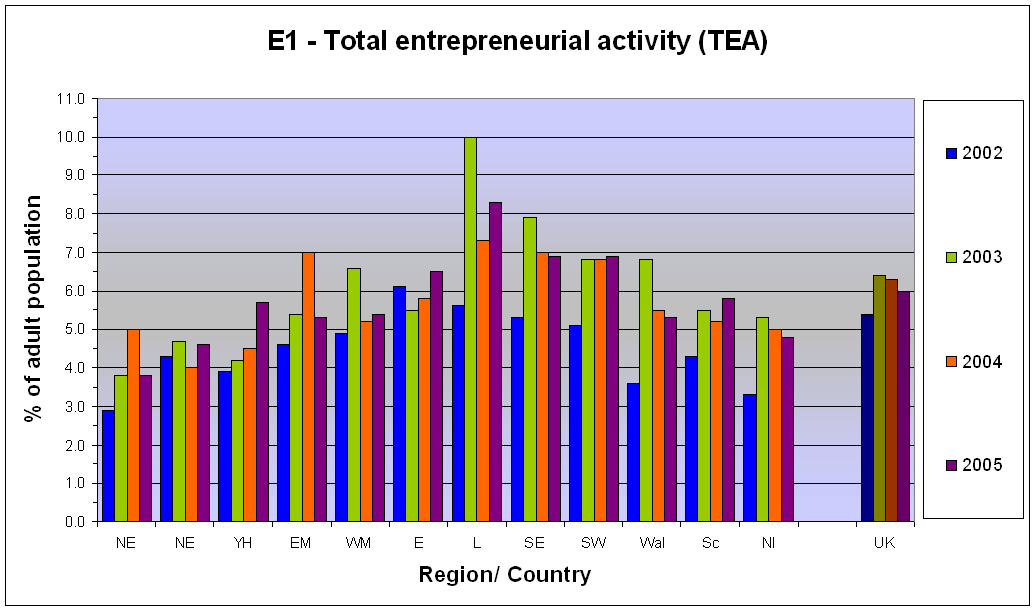
| Table E1 - Total entrepreneurial activity (% of adult population involved in such activity) | ||
| Per cent | 2002 | 2003 | 2004 | 2005 | |
| North East | NE | 2.9 | 3.8 | 5.0 | 3.8 |
| North West | NE | 4.3 | 4.7 | 4.0 | 4.6 |
| Yorkshire & the Humber | YH | 3.9 | 4.2 | 4.5 | 5.7 |
| East Midlands | EM | 4.6 | 5.4 | 7.0 | 5.3 |
| West Midlands | WM | 4.9 | 6.6 | 5.2 | 5.4 |
| East of England | E | 6.1 | 5.5 | 5.8 | 6.5 |
| London | L | 5.6 | 10.0 | 7.3 | 8.3 |
| South East | SE | 5.3 | 7.9 | 7.0 | 6.9 |
| South West | SW | 5.1 | 6.8 | 6.8 | 6.9 |
| England | Eng | ||||
| Wales | Wal | 3.6 | 6.8 | 5.5 | 5.3 |
| Scotland | Sc | 4.3 | 5.5 | 5.2 | 5.8 |
| Northern Ireland | NI | 3.3 | 5.3 | 5.0 | 4.8 |
| United Kingdom | UK | 5.4 | 6.4 | 6.3 | 6.0 |
| Source: Global Enterprise Monitor UK survey | |||||

Last updated on 19 January, 2007