|
|
Economics and Statistics Website : Regional Economic Performance PSA Indicators |
|
|
|
 |
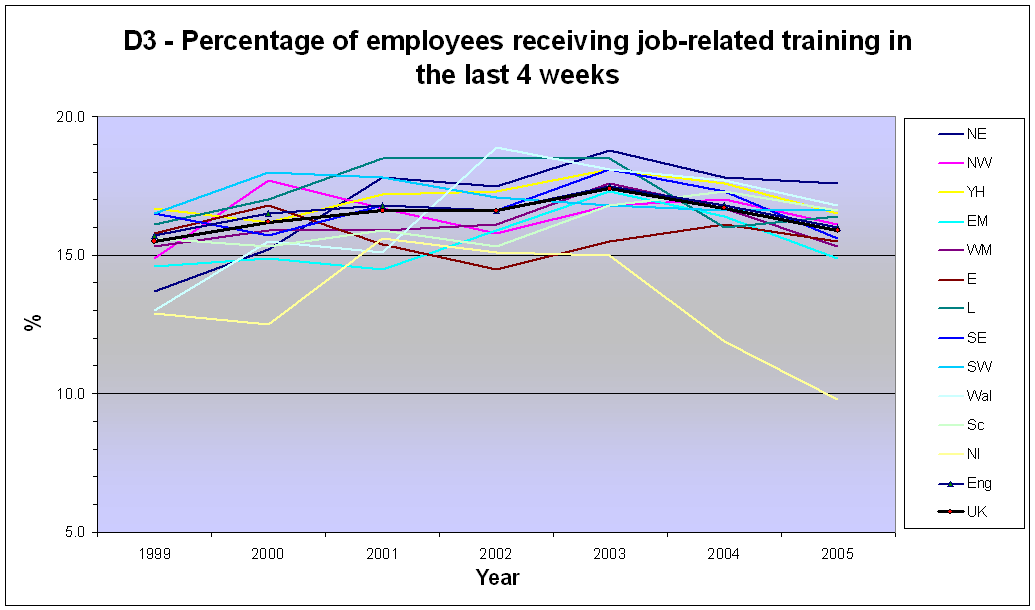
| Table D3 - Percentage of employees receiving job-related training within the last 4 weeks1 | ||||||||||||||||||||
| Per cent | 1999 | 2000 | 2001 | 2002 | 2003 | 2004 | 2005 | |||||||||||||
| Spring | Autumn | Spring | Autumn | Spring | Autumn | Spring | Autumn | Spring | Autumn | Spring | Autumn | Spring | Autumn | |||||||
| North East | 16.7 | 13.7 | 15.4 | 15.2 | 15.6 | 17.8 | 18.0 | 17.5 | 15.9 | 18.8 | 19.2 | 17.8 | 18.2 | 17.6 | ||||||
| North West | 14.8 | 14.9 | 16.8 | 17.7 | 17.3 | 16.7 | 16.4 | 15.8 | 15.8 | 16.8 | 16.0 | 17.0 | 16.4 | 16.1 | ||||||
| Yorkshire and the Humber | 17.7 | 16.7 | 16.4 | 16.2 | 16.9 | 17.2 | 16.6 | 17.3 | 16.6 | 18.1 | 16.5 | 17.6 | 16.5 | 16.5 | ||||||
| East Midlands | 14.7 | 14.6 | 15.7 | 14.9 | 14.4 | 14.5 | 15.8 | 15.9 | 14.0 | 17.3 | 17.0 | 16.4 | 17.3 | 14.9 | ||||||
| West Midlands | 15.9 | 15.3 | 16.0 | 15.9 | 16.7 | 15.9 | 16.1 | 16.1 | 15.2 | 17.6 | 15.3 | 16.7 | 15.6 | 15.3 | ||||||
| East of England | 15.8 | 15.8 | 15.7 | 16.8 | 16.1 | 15.4 | 14.7 | 14.5 | 14.7 | 15.5 | 14.5 | 16.1 | 15.8 | 15.5 | ||||||
| London | 16.1 | 16.1 | 16.9 | 17.0 | 17.8 | 18.5 | 18.0 | 18.5 | 16.5 | 18.5 | 16.3 | 16.0 | 14.4 | 16.4 | ||||||
| South East | 17.4 | 16.5 | 16.0 | 15.7 | 16.7 | 16.8 | 17.7 | 16.6 | 15.6 | 18.1 | 16.5 | 17.3 | 17.0 | 15.6 | ||||||
| South West | 16.4 | 16.5 | 17.7 | 18.0 | 17.1 | 17.8 | 17.5 | 17.1 | 16.1 | 16.8 | 16.1 | 16.6 | 16.5 | 16.6 | ||||||
| England | 16.2 | 15.7 | 16.4 | 16.5 | 16.7 | 16.8 | 16.8 | 16.6 | 15.6 | 17.5 | 16.2 | 16.8 | 16.3 | 16.0 | ||||||
| Wales | 14.8 | 13.0 | 15.9 | 15.5 | 16.1 | 15.1 | 17.3 | 18.9 | 18.3 | 18.1 | 18.2 | 17.7 | 17.7 | 16.8 | ||||||
| Scotland | 15.0 | 15.6 | 15.4 | 15.3 | 15.3 | 15.9 | 15.3 | 15.3 | 15.1 | 16.8 | 16.2 | 17.3 | 15.6 | 16.6 | ||||||
| Northern Ireland | 12.8 | 12.9 | 10.7 | 12.5 | 13.2 | 15.6 | 14.2 | 15.1 | 13.9 | 15.0 | 10.6 | 11.9 | 11.8 | 9.8 | ||||||
| United Kingdom | 15.9 | 15.5 | 16.1 | 16.2 | 16.4 | 16.6 | 16.6 | 16.6 | 15.7 | 17.4 | 16.1 | 16.7 | 16.2 | 15.9 | ||||||
| Source: Department for Education and Skills analyses of the ONS Labour Force Survey | ||||||||||||||||||||
| Note | ||||||||||||||||||||
| 1. These figures use the post census reweighted data. | ||||||||||||||||||||
Last updated on 19 January, 2007