|
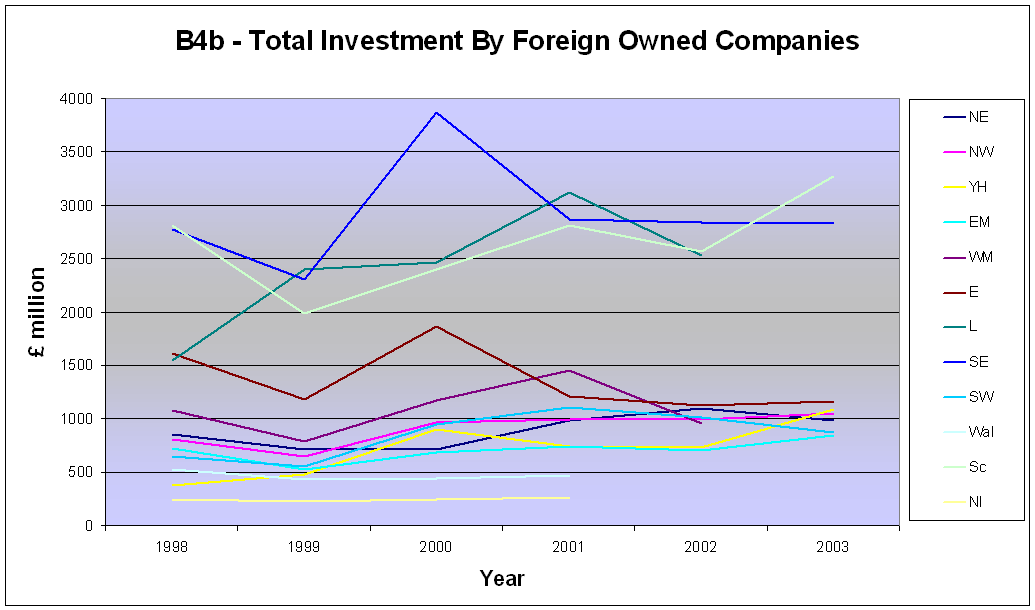
Table B4b - Total Investment by Foreign owned companies |
|
|
� |
� |
� |
� |
� |
� |
� |
� |
|
� million |
1998 |
1999 |
2000 |
2001 |
2002 |
2003 |
� |
Average (1998-2003) |
|
|
� |
� |
� |
� |
� |
� |
� |
� |
|
North East |
����� 859 |
����� 721 |
����� 716 |
����� 985 |
�� 1,101 |
����� 985 |
� |
������������������������ 895 |
|
North West |
����� 802 |
����� 649 |
����� 965 |
����� 993 |
����� 992 |
�� 1,048 |
� |
������������������������ 908 |
|
Yorkshire and the Humber |
����� 375 |
����� 473 |
����� 901 |
����� 742 |
����� 738 |
�� 1,088 |
� |
������������������������ 720 |
|
East Midlands |
����� 726 |
����� 526 |
����� 683 |
����� 747 |
����� 702 |
����� 844 |
� |
������������������������ 705 |
|
West Midlands |
�� 1,082 |
����� 789 |
�� 1,179 |
�� 1,452 |
����� 962 |
�..� |
� |
�..� |
|
East of England |
�� 1,607 |
�� 1,187 |
�� 1,863 |
�� 1,210 |
�� 1,124 |
�� 1,166 |
� |
���������������������� 1,360 |
|
London |
�� 1,548 |
�� 2,403 |
�� 2,464 |
�� 3,118 |
�� 2,530 |
�..� |
� |
�..� |
|
South East |
�� 2,774 |
�� 2,308 |
�� 3,873 |
�� 2,872 |
�� 2,842 |
�� 2,826 |
� |
���������������������� 2,916 |
|
South West |
����� 647 |
����� 552 |
����� 952 |
�� 1,109 |
�� 1,007 |
����� 872 |
� |
������������������������ 857 |
|
|
� |
� |
� |
� |
� |
� |
� |
� |
|
England |
�10,420 |
�� 9,607 |
�13,597 |
�13,229 |
�11,997 |
�13,005 |
� |
�������������������� 11,976 |
|
|
� |
� |
� |
� |
� |
� |
� |
� |
|
Wales |
����� 527 |
����� 436 |
����� 443 |
����� 468 |
�..� |
�..� |
� |
�..� |
|
Scotland |
�� 2,810 |
�� 1,988 |
�� 2,401 |
�� 2,809 |
�� 2,566 |
�� 3,268 |
� |
���������������������� 2,640 |
|
Northern Ireland |
����� 243 |
����� 227 |
����� 243 |
����� 257 |
�..� |
�..� |
� |
�..� |
|
|
� |
� |
� |
� |
� |
� |
� |
� |
|
United Kingdom |
�14,001 |
�12,258 |
�16,685 |
�16,762 |
�..� |
�..� |
� |
�..� |
|
|
� |
� |
� |
� |
� |
� |
� |
� |
|
.. Disclosive data. |
� |
� |
� |
� |
� |
� |
� |
� |
|
1� ABI data omit some parts of the Services and Other categories (see
section 1 of Definitions for details).� Please see ABI section of the
National Statistics website for more on methodology (www.statistics.gov.uk/abi). |
|
|
� |
� |
� |
� |
� |
� |
� |
� |
|
Source: Annual Business Inquiry (ABI), Office for National Statistics |
� |
� |
� |
� |


