|
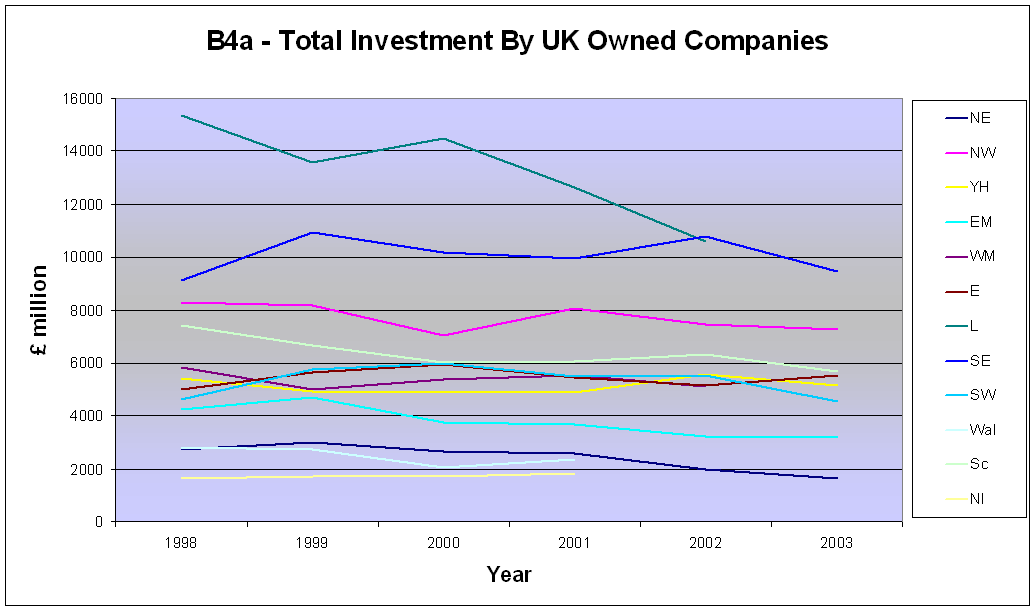
Table B4a - Total Investment by UK owned companies |
|
|
� |
� |
� |
� |
� |
� |
� |
� |
|
� million |
1998 |
1999 |
2000 |
2001 |
2002 |
2003 |
� |
Average (1998-2003) |
|
|
� |
� |
� |
� |
� |
� |
� |
� |
|
North East |
������ 2,765 |
������ 3,008 |
������ 2,636 |
������ 2,575 |
������ 1,998 |
������ 1,625 |
� |
������������������������� 2,435 |
|
North West |
������ 8,304 |
������ 8,173 |
������ 7,029 |
������ 8,039 |
������ 7,475 |
������ 7,296 |
� |
������������������������� 7,719 |
|
Yorkshire and the Humber |
������ 5,406 |
������ 4,912 |
������ 4,889 |
������ 4,890 |
������ 5,565 |
������ 5,154 |
� |
������������������������� 5,136 |
|
East Midlands |
������ 4,252 |
������ 4,711 |
������ 3,770 |
������ 3,692 |
������ 3,246 |
������ 3,165 |
� |
������������������������� 3,806 |
|
West Midlands |
������ 5,830 |
������ 5,017 |
������ 5,358 |
������ 5,534 |
������ 5,128 |
�..� |
� |
�..� |
|
East of England |
������ 4,978 |
������ 5,659 |
������ 5,973 |
������ 5,431 |
������ 5,154 |
������ 5,553 |
� |
������������������������� 5,458 |
|
London |
����� 15,347 |
����� 13,603 |
����� 14,469 |
����� 12,629 |
����� 10,604 |
�..� |
� |
�..� |
|
South East |
������ 9,120 |
����� 10,961 |
����� 10,162 |
������ 9,958 |
����� 10,766 |
������ 9,450 |
� |
������������������������ 10,070 |
|
South West |
������ 4,641 |
������ 5,761 |
������ 6,001 |
������ 5,494 |
������ 5,534 |
������ 4,568 |
� |
������������������������� 5,333 |
|
|
� |
� |
� |
� |
� |
� |
� |
� |
|
England |
����� 60,643 |
����� 61,804 |
����� 60,288 |
����� 58,241 |
����� 55,468 |
����� 53,316 |
� |
������������������������ 58,293 |
|
|
� |
� |
� |
� |
� |
� |
� |
� |
|
Wales |
������ 2,835 |
������ 2,728 |
������ 2,056 |
������ 2,368 |
�..� |
�..� |
� |
�..� |
|
Scotland |
������ 7,441 |
������ 6,675 |
������ 6,046 |
������ 6,078 |
������ 6,307 |
������ 5,683 |
� |
������������������������� 6,372 |
|
Northern Ireland |
������ 1,637 |
������ 1,705 |
������ 1,695 |
������ 1,827 |
�..� |
�..� |
� |
�..� |
|
|
� |
� |
� |
� |
� |
� |
� |
� |
|
United Kingdom |
����� 72,556 |
����� 72,911 |
����� 70,084 |
����� 68,514 |
�..� |
�..� |
� |
�..� |
|
|
� |
� |
� |
� |
� |
� |
� |
� |
|
.. Disclosive data. |
� |
� |
� |
� |
� |
� |
� |
� |
|
1� ABI data omit some parts of the Services and Other categories (see
section 1 of Definitions for details).� Please see ABI section of the
National Statistics website for more on methodology (www.statistics.gov.uk/abi). |
|
|
� |
� |
� |
� |
� |
� |
� |
� |
|
Source: Annual Business Inquiry (ABI), Office for National Statistics |
� |
� |
� |
� |
� |


