|
|
| � | � |
Economics and Statistics Website : Regional Economic Performance PSA Indicators |
|
|
|
 |
| � | ||
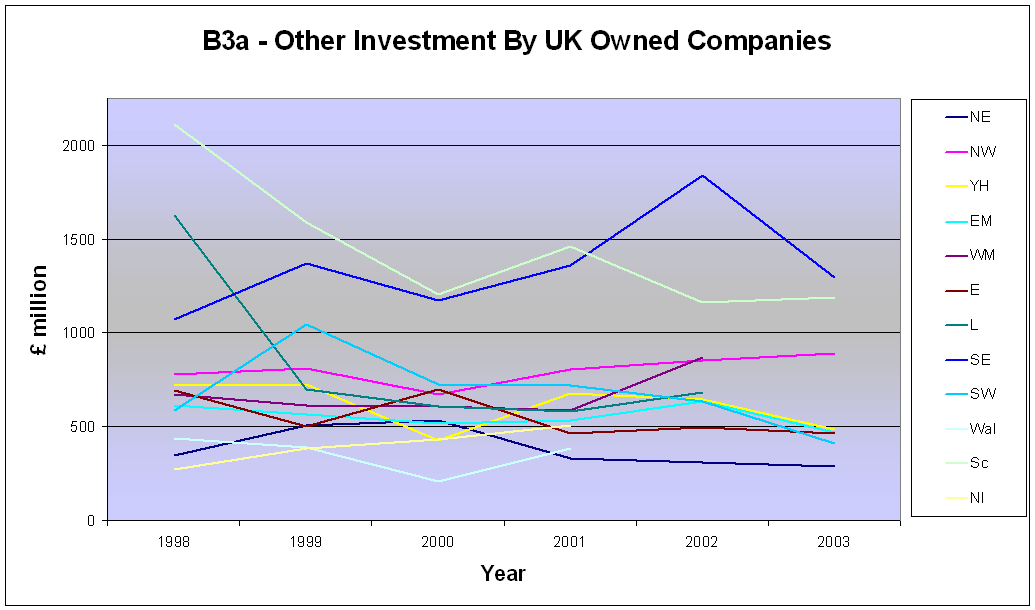
| Table B3a - Other investment by UK owned companies | ||||||||
| � | � | � | � | � | � | � | � | |
| � million | 1998 | 1999 | 2000 | 2001 | 2002 | 2003 | � | Average (1998-2003) |
| � | � | � | � | � | � | � | � | |
| North East | ��� 351 | ��� 513 | ��� 535 | ��� 332 | ��� 310 | ��� 288 | � | ������������������������������� 388 |
| North West | ��� 780 | ��� 810 | ��� 675 | ��� 805 | ��� 856 | ��� 889 | � | ������������������������������� 803 |
| Yorkshire and the Humber | ��� 720 | ��� 726 | ��� 425 | ��� 678 | ��� 650 | ��� 486 | � | ������������������������������� 614 |
| East Midlands | ��� 616 | ��� 566 | ��� 520 | ��� 535 | ��� 632 | ��� 473 | � | ������������������������������� 557 |
| West Midlands | ��� 673 | ��� 616 | ��� 608 | ��� 590 | ��� 870 | �..� | � | �..� |
| East of England | ��� 691 | ��� 500 | ��� 698 | ��� 468 | ��� 495 | ��� 467 | � | ������������������������������� 553 |
| London | �1,628 | ��� 699 | ��� 610 | ��� 587 | ��� 684 | �..� | � | �..� |
| South East | �1,073 | �1,372 | �1,176 | �1,362 | �1,836 | �1,295 | � | ���������������������������� 1,352 |
| South West | ��� 588 | �1,047 | ��� 729 | ��� 724 | ��� 633 | ��� 412 | � | ������������������������������� 689 |
| � | � | � | � | � | � | � | � | |
| England | �7,120 | �6,850 | �5,975 | �6,082 | �6,965 | �5,643 | � | ���������������������������� 6,439 |
| � | � | � | � | � | � | � | � | |
| Wales | ��� 438 | ��� 395 | ��� 211 | ��� 389 | �..� | �..� | � | �..� |
| Scotland | �2,111 | �1,594 | �1,202 | �1,461 | �1,164 | �1,189 | � | ���������������������������� 1,454 |
| Northern Ireland | ��� 277 | ��� 388 | ��� 430 | ��� 506 | �..� | �..� | � | �..� |
| � | � | � | � | � | � | � | � | |
| United Kingdom | �9,947 | �9,226 | �7,819 | �8,438 | �..� | �..� | � | �..� |
| � | � | � | � | � | � | � | � | |
| .. Disclosive data. | � | � | � | � | � | � | � | � |
| 1� ABI data omit some parts of the Services and Other categories (see section 1 of Definitions for details).� Please see ABI section of the National Statistics website for more on methodology (www.statistics.gov.uk/abi). | ||||||||
| � | � | � | � | � | � | � | � | |
| Source: Annual Business Inquiry (ABI), Office for National Statistics | � | � | � | |||||
Last updated on 19 January, 2007