|
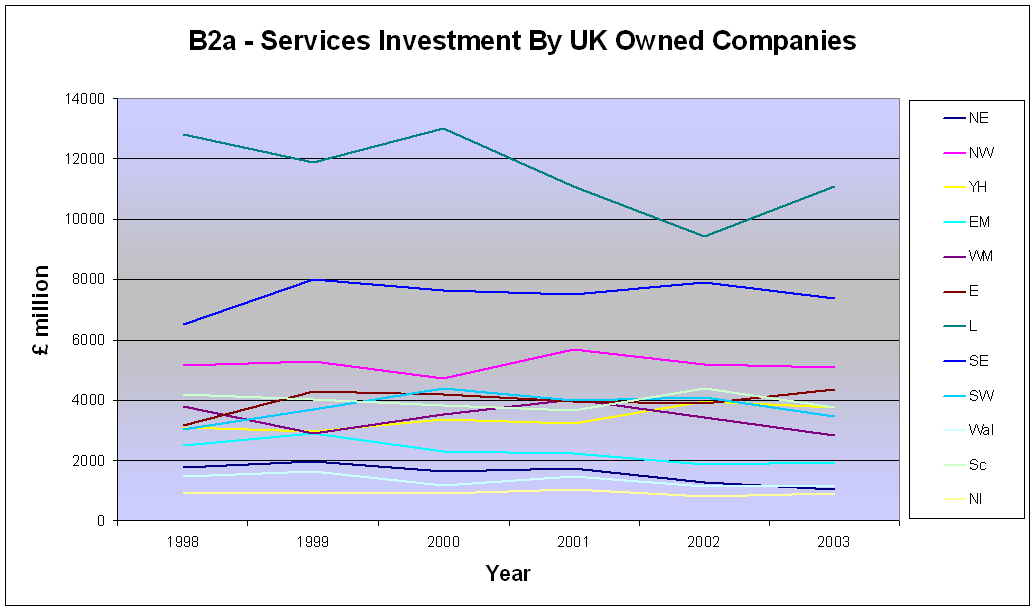
Table B2a - Services investment by UK owned companies |
|
|
� |
� |
� |
� |
� |
� |
� |
� |
|
� million |
1998 |
1999 |
2000 |
2001 |
2002 |
2003 |
� |
Average (1998-2003) |
|
|
� |
� |
� |
� |
� |
� |
� |
� |
|
North East |
������ 1,762 |
������ 1,942 |
������ 1,649 |
������ 1,735 |
������ 1,297 |
������ 1,037 |
� |
������������������������ 1,570 |
|
North West |
������ 5,168 |
������ 5,278 |
������ 4,701 |
������ 5,673 |
������ 5,206 |
������ 5,064 |
� |
������������������������ 5,182 |
|
Yorkshire and the Humber |
������ 3,076 |
������ 2,964 |
������ 3,361 |
������ 3,242 |
������ 3,969 |
������ 3,756 |
� |
������������������������ 3,395 |
|
East Midlands |
������ 2,508 |
������ 2,911 |
������ 2,283 |
������ 2,217 |
������ 1,867 |
������ 1,921 |
� |
������������������������ 2,285 |
|
West Midlands |
������ 3,776 |
������ 2,908 |
������ 3,509 |
������ 4,021 |
������ 3,412 |
������ 2,844 |
� |
������������������������ 3,412 |
|
East of England |
������ 3,159 |
������ 4,291 |
������ 4,182 |
������ 3,951 |
������ 3,872 |
������ 4,343 |
� |
������������������������ 3,966 |
|
London |
����� 12,809 |
����� 11,854 |
����� 12,998 |
����� 11,107 |
������ 9,402 |
����� 11,072 |
� |
���������������������� 11,540 |
|
South East |
������ 6,507 |
������ 7,996 |
������ 7,630 |
������ 7,502 |
������ 7,885 |
������ 7,373 |
� |
������������������������ 7,482 |
|
South West |
������ 3,038 |
������ 3,687 |
������ 4,414 |
������ 4,016 |
������ 4,083 |
������ 3,467 |
� |
������������������������ 3,784 |
|
|
� |
� |
� |
� |
� |
� |
� |
� |
|
England |
����� 41,803 |
����� 43,832 |
����� 44,727 |
����� 43,466 |
����� 40,993 |
����� 40,877 |
� |
���������������������� 42,616 |
|
|
� |
� |
� |
� |
� |
� |
� |
� |
|
Wales |
������ 1,472 |
������ 1,646 |
������ 1,153 |
������ 1,478 |
������ 1,124 |
������ 1,158 |
� |
������������������������ 1,339 |
|
Scotland |
������ 4,182 |
������ 4,032 |
������ 3,809 |
������ 3,657 |
������ 4,394 |
������ 3,756 |
� |
������������������������ 3,972 |
|
Northern Ireland |
��������� 932 |
��������� 946 |
��������� 910 |
������ 1,039 |
��������� 835 |
��������� 928 |
� |
��������������������������� 932 |
|
|
� |
� |
� |
� |
� |
� |
� |
� |
|
United Kingdom |
����� 48,389 |
����� 50,456 |
����� 50,599 |
����� 49,640 |
����� 47,345 |
����� 46,719 |
� |
���������������������� 48,858 |
|
|
� |
� |
� |
� |
� |
� |
� |
� |
|
.. Disclosive data. |
� |
� |
� |
� |
� |
� |
� |
� |
|
1� ABI data omit some parts of the Services and Other categories (see
section 1 of Definitions for details).� Please see ABI section of the
National Statistics website for more on methodology (www.statistics.gov.uk/abi). |
|
|
� |
� |
� |
� |
� |
� |
� |
� |
|
Source: Annual Business Inquiry (ABI), Office for National Statistics |
� |
� |
� |
� |
� |


