|
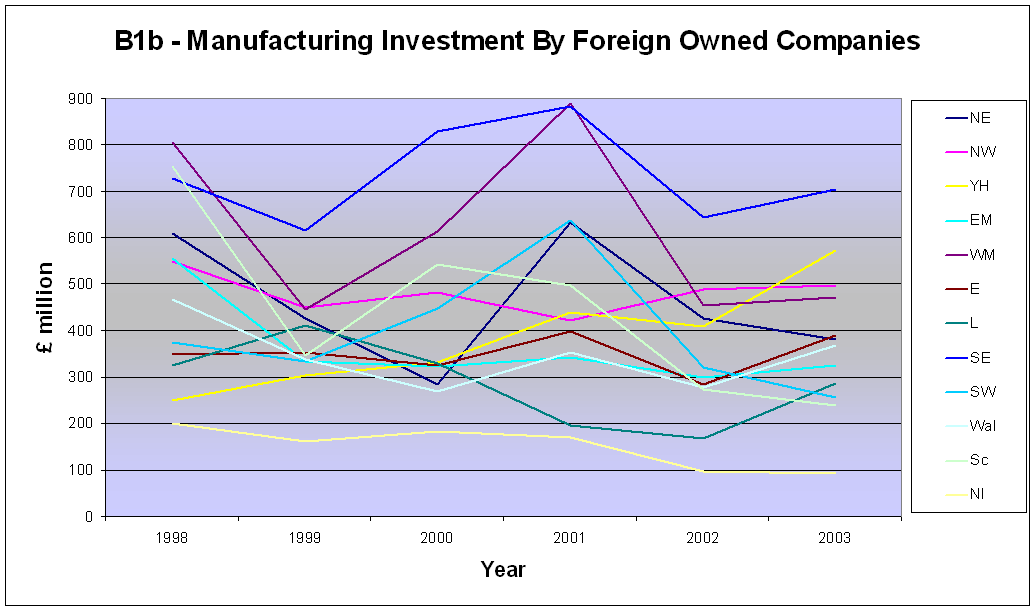
Table B1b - Manufacturing investment by Foreign owned
Companies |
|
|
|
|
|
|
|
|
|
|
|
� million |
1998 |
1999 |
2000 |
2001 |
2002 |
2003 |
� |
Average (1998-2003) |
|
|
� |
� |
� |
� |
� |
� |
� |
� |
|
North East |
��� 610 |
��� 425 |
��� 284 |
��� 633 |
��� 425 |
��� 382 |
� |
������ 460 |
|
North West |
��� 548 |
��� 450 |
��� 483 |
��� 421 |
��� 488 |
��� 497 |
� |
������ 481 |
|
Yorkshire and the Humber |
��� 251 |
��� 304 |
��� 332 |
��� 440 |
��� 409 |
��� 572 |
� |
������ 385 |
|
East Midlands |
��� 554 |
��� 333 |
��� 322 |
��� 341 |
��� 300 |
��� 325 |
� |
������ 363 |
|
West Midlands |
��� 805 |
��� 446 |
��� 614 |
��� 888 |
��� 454 |
��� 470 |
� |
������ 613 |
|
East of England |
��� 347 |
��� 353 |
��� 326 |
��� 398 |
��� 285 |
��� 389 |
� |
������ 350 |
|
London |
��� 323 |
��� 412 |
��� 329 |
��� 196 |
��� 167 |
��� 287 |
� |
������ 286 |
|
South East |
��� 727 |
��� 615 |
��� 828 |
��� 883 |
��� 644 |
��� 704 |
� |
������ 734 |
|
South West |
��� 374 |
��� 334 |
��� 447 |
��� 638 |
��� 320 |
��� 257 |
� |
������ 395 |
|
|
� |
� |
� |
� |
� |
� |
� |
� |
|
England |
�4,540 |
�3,673 |
�3,966 |
�4,837 |
�3,491 |
�3,883 |
� |
��� 4,065 |
|
|
� |
� |
� |
� |
� |
� |
� |
� |
|
Wales |
��� 466 |
��� 338 |
��� 269 |
��� 354 |
��� 279 |
��� 368 |
� |
������ 346 |
|
Scotland |
��� 753 |
��� 345 |
��� 543 |
��� 497 |
��� 273 |
��� 239 |
� |
������ 442 |
|
Northern Ireland |
��� 201 |
��� 160 |
��� 182 |
��� 169 |
����� 98 |
����� 91 |
� |
������ 150 |
|
|
� |
� |
� |
� |
� |
� |
� |
� |
|
United Kingdom |
�5,960 |
�4,517 |
�4,959 |
�5,857 |
�4,143 |
�4,581 |
� |
��� 5,003 |
|
|
� |
� |
� |
� |
� |
� |
� |
� |
|
.. Disclosive data. |
� |
� |
� |
� |
� |
� |
� |
� |
|
1� ABI data omit some parts of the Services and Other categories (see
section 1 of Definitions for details).� Please see ABI section of the
National Statistics website for more on methodology (www.statistics.gov.uk/abi). |
|
|
� |
� |
� |
� |
� |
� |
� |
� |
|
Source: Annual Business Inquiry (ABI), Office for National Statistics |
� |
� |
� |


