
|
|
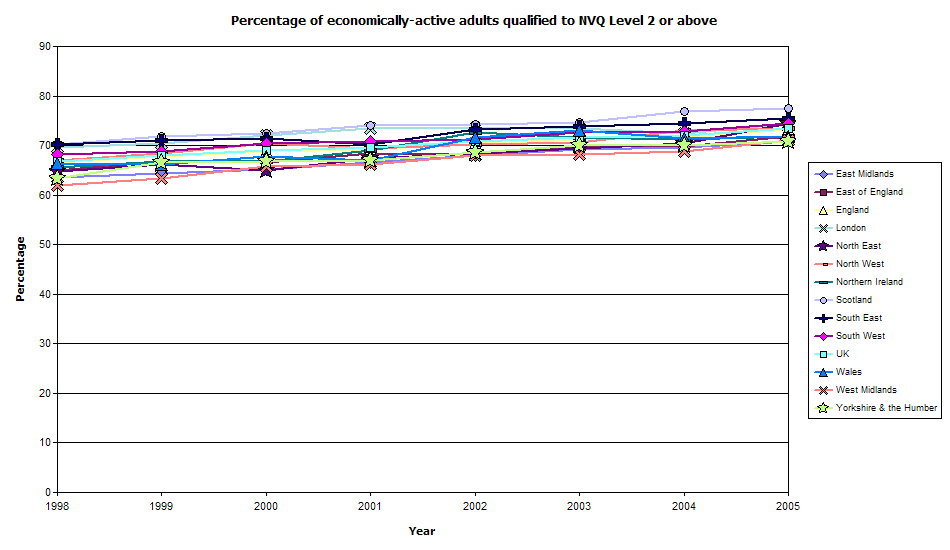
Percentage of economically-active adults qualified to NVQ Level 2 or above |
| Region | ONS Code | 1998 | 1998 | 1999 | 1999 | 2000 | 2000 | 2001 | 2001 | 2002 | 2002 | 2003 | 2003 | 2004 | 2004 | 2005 | 2005 |
| Spring | Autumn | Spring | Autumn | Spring | Autumn | Spring | Autumn | Spring | Autumn | Spring | Autumn | Spring | Autumn | Spring | Autumn | ||
| North East | A | 62.5 | 64.7 | 65.6 | 66.1 | 66.3 | 65.0 | 67.3 | 67.3 | 68.7 | 68.4 | 69.2 | 69.4 | 70.2 | 70.4 | 72.1 | 74.5 |
| North West | B | 66.1 | 67.0 | 68.4 | 68.5 | 69.3 | 70.5 | 70.2 | 69.5 | 68.9 | 70.3 | 69.7 | 70.6 | 71.9 | 73.0 | 73.1 | 73.5 |
| Yorkshire & the Humber | D | 62.8 | 63.4 | 64.3 | 66.5 | 66.9 | 66.8 | 66.3 | 66.9 | 68.3 | 68.6 | 68.5 | 70.1 | 69.7 | 70.0 | 70.3 | 70.8 |
| East Midlands | E | 62.7 | 63.5 | 63.3 | 64.4 | 64.8 | 65.2 | 65.2 | 66.6 | 67.9 | 68.1 | 68.2 | 69.3 | 70.4 | 69.7 | 70.7 | 70.9 |
| West Midlands | F | 61.0 | 62.0 | 63.1 | 63.3 | 64.7 | 65.8 | 65.7 | 66.2 | 67.1 | 68.0 | 68.1 | 68.2 | 68.5 | 68.9 | 70.2 | 71.1 |
| East of England | G | 64.3 | 65.0 | 65.9 | 66.8 | 66.7 | 66.6 | 67.3 | 68.5 | 69.2 | 68.2 | 68.9 | 69.8 | 70.3 | 69.9 | 70.0 | 71.9 |
| London | H | 68.8 | 69.7 | 70.5 | 70.5 | 71.2 | 72.1 | 72.4 | 73.4 | 73.0 | 73.4 | 72.9 | 73.4 | 73.2 | 72.4 | 72.5 | 74.4 |
| South East | J | 68.9 | 70.3 | 71.2 | 71.1 | 71.2 | 71.5 | 70.4 | 70.3 | 71.6 | 73.3 | 73.0 | 73.9 | 74.1 | 74.5 | 75.0 | 75.4 |
| South West | K | 66.7 | 68.3 | 68.2 | 68.9 | 69.0 | 70.4 | 70.1 | 70.9 | 70.6 | 71.2 | 71.7 | 72.7 | 72.3 | 72.9 | 73.3 | 74.5 |
| England | 064 | 65.5 | 66.6 | 67.4 | 67.9 | 68.3 | 68.9 | 68.8 | 69.3 | 69.8 | 70.5 | 70.4 | 71.2 | 71.5 | 71.7 | 72.1 | 73.2 |
| Wales | 220 | 65.2 | 66.4 | 66.4 | 66.1 | 67.3 | 67.9 | 66.8 | 66.9 | 67.8 | 71.6 | 71.6 | 73.0 | 72.5 | 71.5 | 69.7 | 71.8 |
| Scotland | 179 | 69.0 | 70.2 | 71.4 | 71.8 | 71.4 | 72.4 | 73.2 | 74.0 | 73.5 | 74.2 | 74.9 | 74.7 | 74.2 | 76.9 | 76.1 | 77.5 |
| Northern Ireland | 152 | 66.0 | 65.5 | 66.9 | 66.8 | 66.6 | 66.8 | 67.0 | 69.1 | 71.4 | 72.6 | 72.9 | 71.6 | 71.9 | 71.2 | 70.8 | 71.8 |
| UK | 213 | 65.8 | 66.8 | 67.7 | 68.1 | 68.5 | 69.1 | 69.1 | 69.6 | 70.1 | 70.9 | 70.9 | 71.6 | 71.8 | 72.1 | 72.3 | 73.4 |
| source: Department for Education and
Skills analyses of the ONS Labour Force Survey |
|||||||||||||||||
| Trend Chart |
 |