
|
|
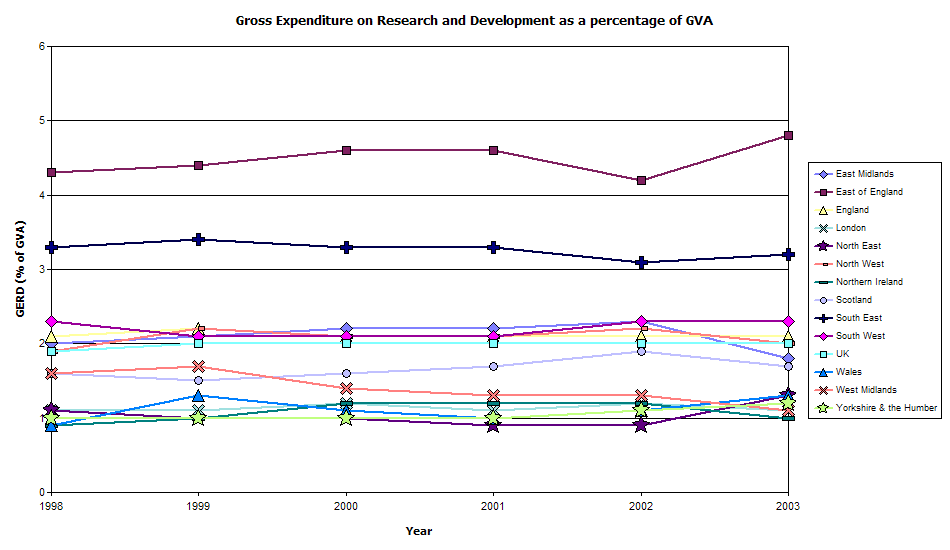
Gross Expenditure on Research and Development as a percentage of GVA |
| Region | ONS Code | 1998 | 1999 | 2000 | 2001 | 2002 | 2003 |
| North East | A | 1.1 | 1.0 | 1.0 | 0.9 | 0.9 | 1.3 |
| North West | B | 1.9 | 2.2 | 2.1 | 2.1 | 2.2 | 2.0 |
| Yorkshire & the Humber | D | 1.0 | 1.0 | 1.0 | 1.0 | 1.1 | 1.2 |
| East Midlands | E | 2.0 | 2.1 | 2.2 | 2.2 | 2.3 | 1.8 |
| West Midlands | F | 1.6 | 1.7 | 1.4 | 1.3 | 1.3 | 1.1 |
| East of England | G | 4.3 | 4.4 | 4.6 | 4.6 | 4.2 | 4.8 |
| London | H | 1.1 | 1.1 | 1.2 | 1.1 | 1.2 | 1.1 |
| South East | J | 3.3 | 3.4 | 3.3 | 3.3 | 3.1 | 3.2 |
| South West | K | 2.3 | 2.1 | 2.1 | 2.1 | 2.3 | 2.3 |
| England | 064 | 2.1 | 2.2 | 2.1 | 2.1 | 2.1 | 2.1 |
| Wales | 220 | 0.9 | 1.3 | 1.1 | 1.0 | 1.1 | 1.3 |
| Scotland | 179 | 1.6 | 1.5 | 1.6 | 1.7 | 1.9 | 1.7 |
| Northern Ireland | 152 | 0.9 | 1.0 | 1.2 | 1.2 | 1.2 | 1.0 |
| UK | 213 | 1.9 | 2.0 | 2.0 | 2.0 | 2.0 | 2.0 |
| source: Business Enterprise R&D Survey
and Regional Accounts, Office for National Statistics note 1 Estimates for the United Kingdom include ex-regio GVA data which are excluded from other areas shown in the table. All GVA data presented here exceed published GVA estimates because the FISIM adjustment has not been made. |
|||||||
| Trend Chart |
 |