|
|
| � | |
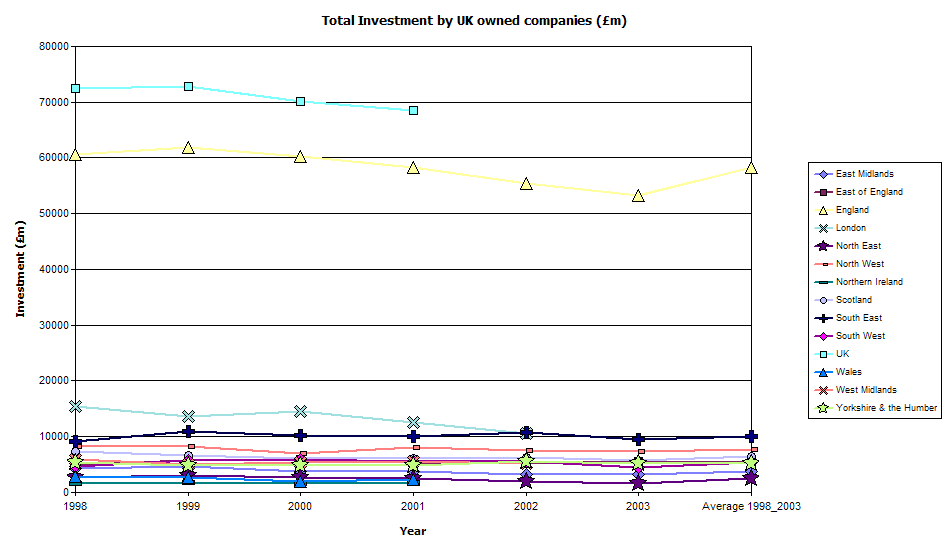
Total Investment1 by UK owned companies (�m) |
| Region | ONS Code | 1998 | 1999 | 2000 | 2001 | 2002 | 2003 | Average 1998_2003 |
| North East | A | 2,765 | 3,008 | 2,636 | 2,575 | 1,998 | 1,625 | 2,435 |
| North West | B | 8,304 | 8,173 | 7,029 | 8,039 | 7,475 | 7,296 | 7,719 |
| Yorkshire & the Humber | D | 5,406 | 4,912 | 4,889 | 4,890 | 5,565 | 5,154 | 5,136 |
| East Midlands | E | 4,252 | 4,711 | 3,770 | 3,692 | 3,246 | 3,165 | 3,806 |
| West Midlands | F | 5,830 | 5,017 | 5,358 | 5,534 | 5,128 | - | - |
| East of England | G | 4,978 | 5,659 | 5,973 | 5,431 | 5,154 | 5,553 | 5,458 |
| London | H | 15,347 | 13,603 | 14,469 | 12,629 | 10,604 | - | - |
| South East | J | 9,120 | 10,961 | 10,162 | 9,958 | 10,766 | 9,450 | 10,070 |
| South West | K | 4,641 | 5,761 | 6,001 | 5,494 | 5,534 | 4,568 | 5,333 |
| England | 064 | 60,643 | 61,804 | 60,288 | 58,241 | 55,468 | 53,316 | 58,293 |
| Wales | 220 | 2,835 | 2,728 | 2,056 | 2,368 | - | - | - |
| Scotland | 179 | 7,441 | 6,675 | 6,046 | 6,078 | 6,307 | 5,683 | 6,372 |
| Northern Ireland | 152 | 1,637 | 1,705 | 1,695 | 1,827 | - | - | - |
| UK | 213 | 72,556 | 72,911 | 70,084 | 68,514 | - | - | - |
| Source: Annual Business Inquiry (ABI),
Office for National Statistics note "-" disclosive data 1. ABI data omit some parts of the Services and Other categories. Please see ABI section of the National Statistics website for more on methodology (www.statistics.gov.uk/abi). � |
||||||||
| Trend Chart |
 |
�