|
|
| � | |
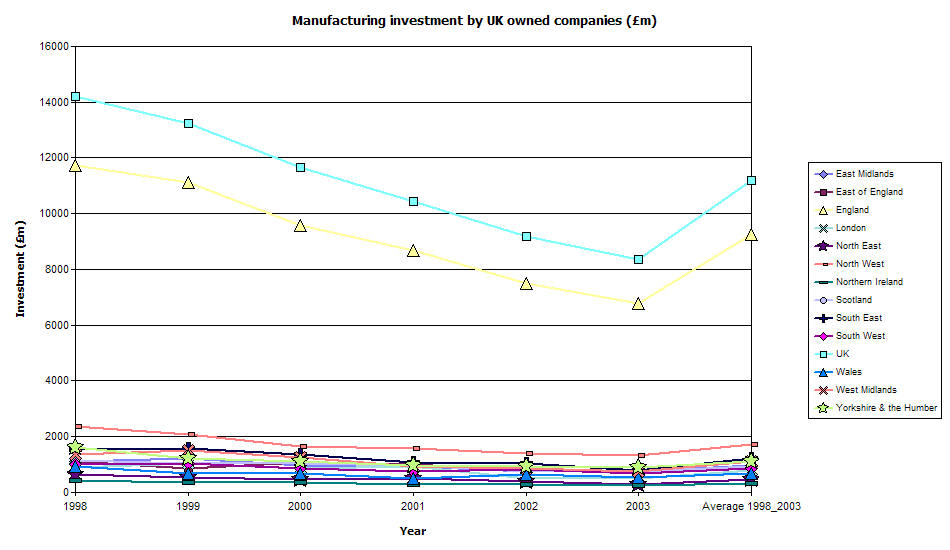
Manufacturing investment1 by UK owned companies (�m) |
| Region | ONS Code | 1998 | 1999 | 2000 | 2001 | 2002 | 2003 | Average 1998_2003 |
| North East | A | 651 | 552 | 452 | 507 | 391 | 300 | 476 |
| North West | B | 2,356 | 2,084 | 1,652 | 1,561 | 1,413 | 1,343 | 1,735 |
| Yorkshire & the Humber | D | 1,610 | 1,222 | 1,104 | 969 | 946 | 912 | 1,127 |
| East Midlands | E | 1,129 | 1,234 | 967 | 940 | 747 | 771 | 965 |
| West Midlands | F | 1,380 | 1,494 | 1,242 | 923 | 846 | 736 | 1,104 |
| East of England | G | 1,128 | 868 | 1,093 | 1,012 | 787 | 743 | 939 |
| London | H | 910 | 1,050 | 861 | 934 | 518 | 520 | 799 |
| South East | J | 1,540 | 1,592 | 1,356 | 1,093 | 1,045 | 782 | 1,235 |
| South West | K | 1,015 | 1,027 | 858 | 754 | 818 | 689 | 860 |
| England | 064 | 11,719 | 11,123 | 9,586 | 8,693 | 7,510 | 6,796 | 9,238 |
| Wales | 220 | 925 | 687 | 691 | 501 | 632 | 552 | 665 |
| Scotland | 179 | 1,148 | 1,049 | 1,034 | 960 | 749 | 738 | 946 |
| Northern Ireland | 152 | 428 | 371 | 355 | 282 | 285 | 265 | 331 |
| UK | 213 | 14,220 | 13,229 | 11,665 | 10,436 | 9,176 | 8,350 | 11,179 |
| Source: Annual Business Inquiry (ABI),
Office for National Statistics note 1. ABI data omit some parts of the Services and Other categories. Please see ABI section of the National Statistics website for more on methodology (www.statistics.gov.uk/abi). � |
||||||||
| Trend Chart |
 |
�