FLUID POWER STATISTICS

The first question asked by most people on
hearing about the British Fluid Power
Association (BFPA) is �what is fluid
power?�. The standard answer is power
transmission and motion control through
the use of pressurised oil or air, and at this
stage some people understand what we are
about. Others though, do not, and only do
so when we go on to describe the
equipment which gives the three dimensional
movement required in all sorts
of industrial and mobile machines like
scoops on diggers, arms on robots or pick
and place machines on factory production
lines.
The BFPA represents the interests of manufacturers and suppliers (including distributors) of fluid power equipment � typically companies selling products such as pumps, valves, actuators, air preparation equipment, hose, fittings and fluids, which end up in either hydraulic or pneumatic systems for the sorts of applications mentioned earlier. This is only the tip of the iceberg with many other related products such as testing equipment and an increasing amount of electronic components also being considered as part of the industry. The UK market for fluid power components was estimated to be around �600 million in 2001, with total sales of around �900 million; this excludes the added value of the hydraulic systems building market, which would take the figures higher. With over 9,000 people employed in the UK and a net exporter, the fluid power industry is a significant player within the engineering sector of UK manufacturing.
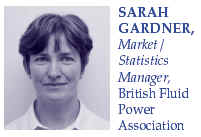
The BFPA, like most other trade associations offers a statistical service to its members, which draws on both official sources of data and in-house surveys. The statistical department at BFPA is staffed by one parttimer (me!) with some assistance from another member of staff. Being a somewhat �hidden� industry has possibly contributed to the poor coverage of our industry in the official statistics over the years. Unlike many other industries, such as machine tools, we do not have a specific class within the NACE industrial classification, which means that the few products we have attributed to our industry are scattered across several other classes. Operation 2007 offers our industry an opportunity to change this and BFPA is working on a proposal with its European Federation, CETOP, to rectify this.�
As for UK production sales, there are around 18 specific fluid power Prodcom codes within the UK covering many of the main product ranges in the industry. However there are significant omissions (for example hose and fittings which are classified by the materials from which they are made, with no further reference to hydraulic or pneumatic use), which prevent the full picture for the fluid power industry emerging from the official data. Some members track Prodcom data for user industries, for example forklift trucks or construction equipment, which can provide useful indicators of performance for specific end use markets.
Corresponding trade data are available from HM Customs & Excise through Intrastat and Extrastat for the 15 or so codes we have in the Combined Nomenclature, however members have in the past questioned the quality of the data in some areas, and treat them with a certain amount of caution.
Another source of official data helpful to members is MM22 containing the Producer Price Indices, however this is more from the point of view of tracking prices in the diverse range of end user markets, than within the fluid power industry itself, since we were unfortunate enough to lose the continuation of an 8-digit series of data specific to our industry in a recent review by the Office for National Statistics.
Due to the incomplete coverage of official statistics on the UK fluid power market, the BFPA has responded to members� needs for good quality, timely market data by developing a wide range of in-house surveys over recent years. All of its surveys are carried out under strict confidentiality rules, are available only to respondents, and are guided and reviewed regularly by a steering committee made up of a representative sample of members of the association.�
Annual surveys of the UK hydraulic, pneumatic and distributor markets offer factual sales data by detailed product group, distribution channel and end use markets; in recent years market estimations have been added, to try and make the surveys more useful for members. Annual salary and benefits surveys are also carried out for the same markets, offering industry-specific information helpful to many companies� human resources departments.�
Quarterly trends surveys, which mirror the CBI surveys, are carried out in-house, and a core of members also participate in monthly surveys tracking UK shipments and new orders in the hydraulics and pneumatics markets. Both of these sets of surveys offer participants useful information on current and future industry performance.�
Participation levels are extremely high for all the in-house surveys, and it is estimated that respondents to the main annual hydraulic and pneumatic surveys represent around 80% of the total UK market.
BFPA members also have access to European and worldwide fluid power data through exchange programmes developed over recent years (which are based on in-house estimates rather than the official statistics due to the problems of coverage mentioned earlier).
Although most of the BFPA�s statistics use historical data, every autumn BFPA commissions Oxford Economic Forecasting (OEF), one of the country�s leading forecasting consultancies, to produce a 5-year forecast for the fluid power industry. Background industry data, taken from in-house market surveys, as well as official trade data, are provided by BFPA as a basis for these forecasts.�
In conclusion, the statistical service of the BFPA offers members the opportunity to access a unique source of industry data, mostly by participating in its various inhouse surveys. It also helps members access the relevant official sources of information on fluid power and related end use markets. A key long-term goal is to have better industry coverage in the official statistics � if we can achieve the changes we want to the NACE classification under Operation 2007, it will be a major step forward.